Birmingham, AL Pollen and Allergy Report for Summer 2023

Pollen Allergy Trends in Birmingham, AL
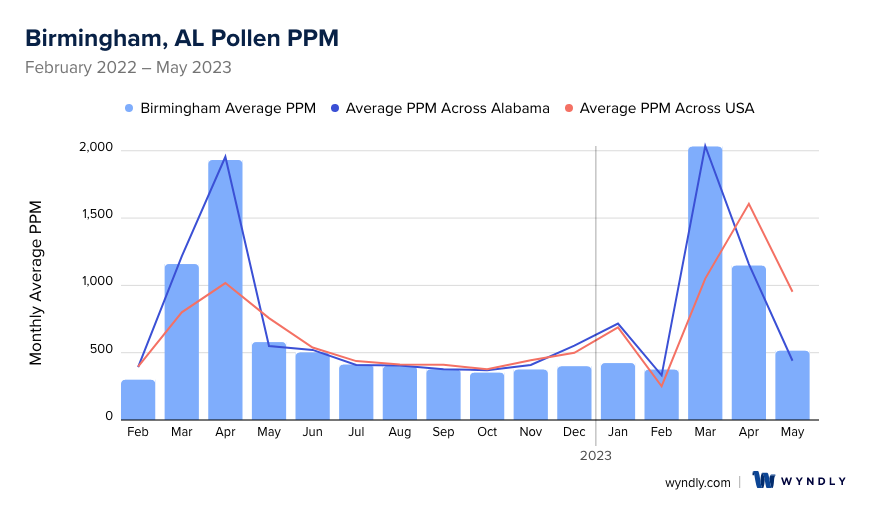
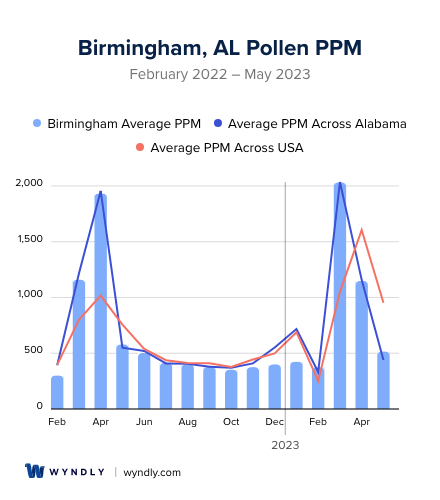
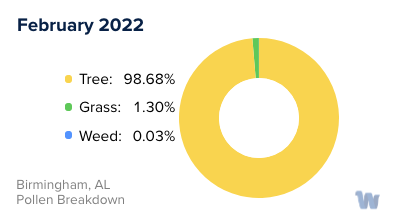
When is pollen lowest in Birmingham, AL?
February
Lowest month total PPM
Avg. PPM
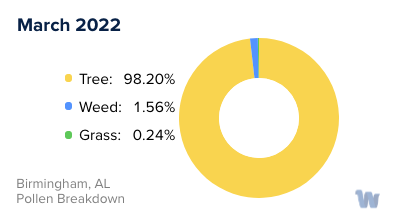
When is pollen highest in Birmingham, AL?
March
Highest month total PPM
Avg. PPM
How does pollen in Birmingham, AL compare to Alabama?
Birmingham has a lower average PPM than the state of Alabama.
Birmingham yearly avg PPM:
Alabama yearly avg PPM:
How does pollen in Birmingham, AL compare to the USA?
Birmingham has a higher average PPM than the USA.
Birmingham yearly avg PPM:
USA yearly avg PPM:
Is pollen worse this year in Birmingham, AL?
Spring 2023 was about the same as 2022.
Spring 2023 PPM:
Spring 2022 PPM:
Average PPM in Birmingham, AL
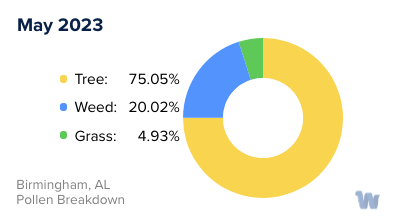
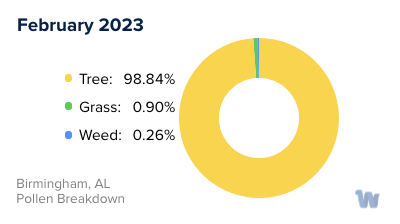
Birmingham, AL Pollen and Allergy Breakdown by Month
Grass
When is grass pollen highest in Birmingham, AL?
April has the highest grass pollen in Birmingham, AL with an average PPM of
When is grass pollen lowest in Birmingham, AL?
October has the lowest grass pollen in Birmingham, AL with an average PPM of
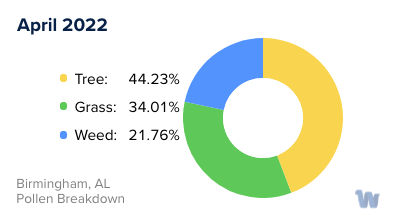
Tree
When is tree pollen highest in Birmingham, AL?
March has the highest tree pollen in Birmingham, AL with an average PPM of
When is tree pollen lowest in Birmingham, AL?
September has the lowest tree pollen in Birmingham, AL with an average PPM of
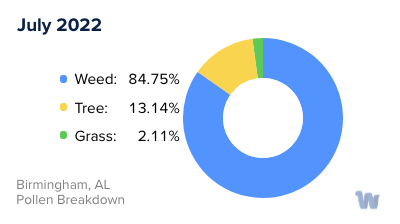
Weed
When is weed pollen highest in Birmingham, AL?
April has the highest weed pollen in Birmingham, AL with an average PPM of
When is weed pollen lowest in Birmingham, AL?
February has the lowest weed pollen in Birmingham, AL with an average PPM of
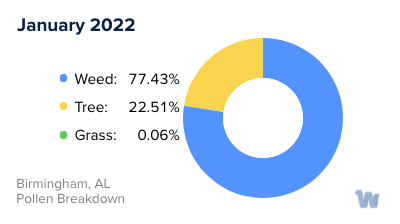
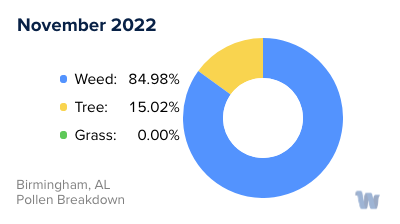
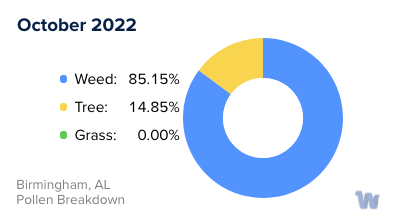
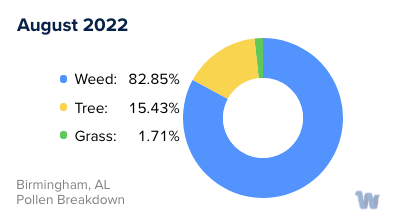
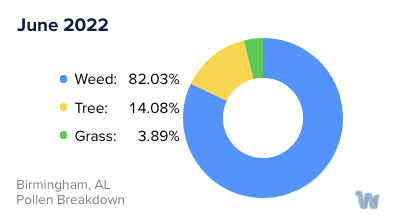
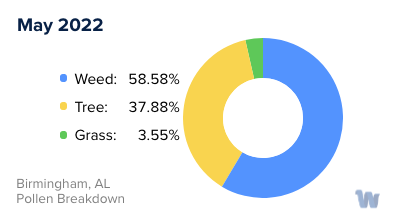
Birmingham, AL Pollen Monthly Breakdown by Pollen Type


Pollen and Hay Fever in Birmingham, AL
In Birmingham, Alabama, residents experience a prolonged allergy season due to the region's generally mild winters, which allow plant life to thrive for most of the year. This lengthy pollen season can pose challenges for those suffering from allergies, as there is only a brief respite during the colder months.
The primary triggers of seasonal allergies in Alabama are pollen from grasses, trees, and weeds. The type of plant releasing pollen—and thereby causing allergies—varies with the seasons. Pollen allergies can flare up at different times of the year, depending on the specific allergen.
Spring, summer, and fall are the primary seasons for pollen allergies in Birmingham. The allergy season commences in spring, as early as January, due to Alabama's mild winter. During spring, most allergies are the result of tree pollen. As the year progresses into summer, grass pollen becomes the main culprit. If you find yourself struggling with seasonal allergies in the fall, it's likely due to pollen from weeds.
The peak periods for seasonal allergies typically occur in April, May, June, and September. During these months, pollen counts are at their highest, potentially exacerbating symptoms for allergy sufferers. The allergy season usually concludes in November, offering residents a brief hiatus from their seasonal allergies.
Among the most common allergens in Alabama are various grasses such as Timothy grass, Johnson grass, and Bermuda grass. Weeds like Russian thistle, English plantain, and ragweed are also frequent triggers. Various trees contribute to the mix, including the Juniper tree, Olive tree, Alder tree, Elder birch, and Maple tree. Each of these plants releases pollen at different times of the year, contributing to the extended allergy season experienced in Birmingham, Alabama.