Albany, NY Pollen and Allergy Report for Summer 2023

Pollen Allergy Trends in Albany, NY
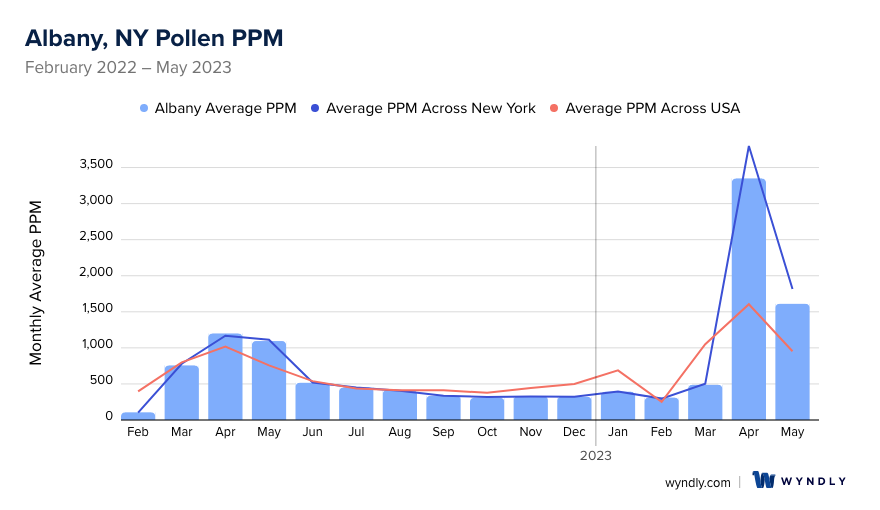
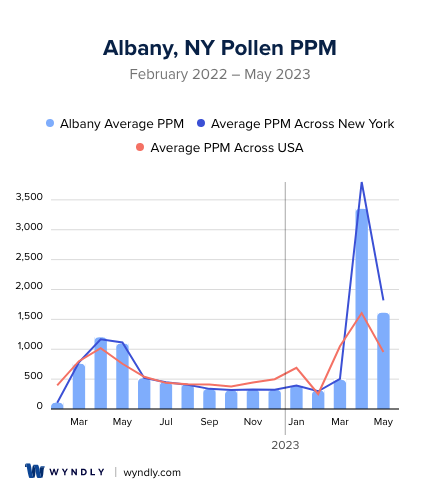
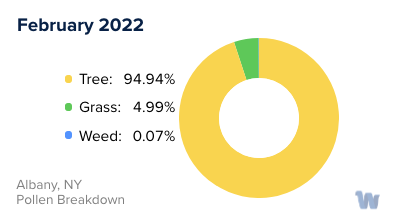
When is pollen lowest in Albany, NY?
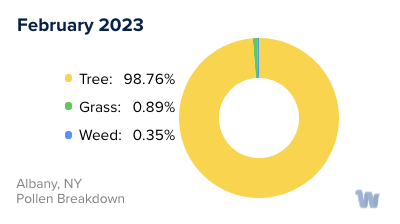
February
Lowest month total PPM
Avg. PPM
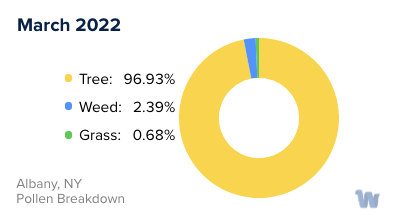
When is pollen highest in Albany, NY?
April
Highest month total PPM
Avg. PPM
How does pollen in Albany, NY compare to New York?
Albany has a lower average PPM than the state of New York.
Albany yearly avg PPM:
New York yearly avg PPM:
How does pollen in Albany, NY compare to the USA?
Albany has a higher average PPM than the USA.
Albany yearly avg PPM:
USA yearly avg PPM:
Is pollen worse this year in Albany, NY?
Spring 2023 was worse than spring 2022.
Spring 2023 PPM:
Spring 2022 PPM:
Average PPM in Albany, NY
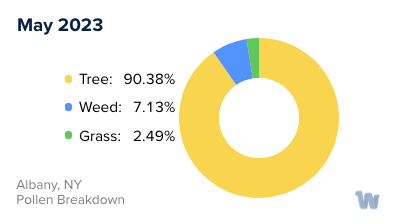
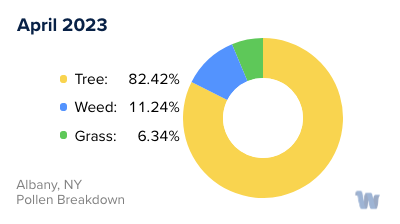
Albany, NY Pollen and Allergy Breakdown by Month
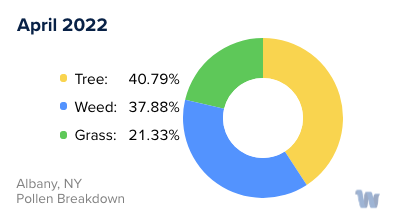
Grass
When is grass pollen highest in Albany, NY?
April has the highest grass pollen in Albany, NY with an average PPM of
When is grass pollen lowest in Albany, NY?
December has the lowest grass pollen in Albany, NY with an average PPM of
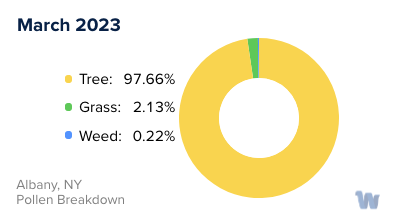
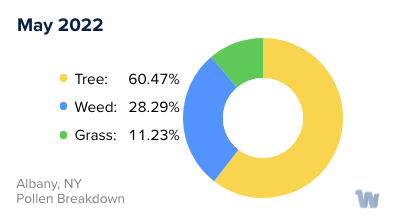
Tree
When is tree pollen highest in Albany, NY?
April has the highest tree pollen in Albany, NY with an average PPM of
When is tree pollen lowest in Albany, NY?
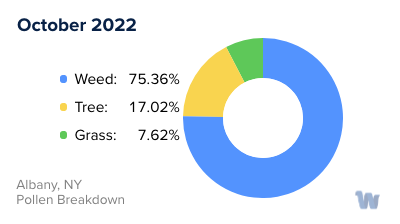
October has the lowest tree pollen in Albany, NY with an average PPM of
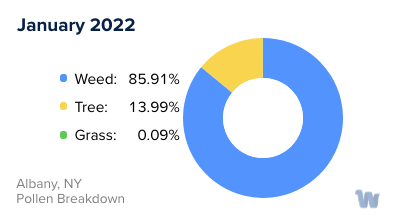
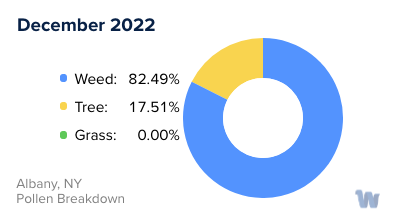
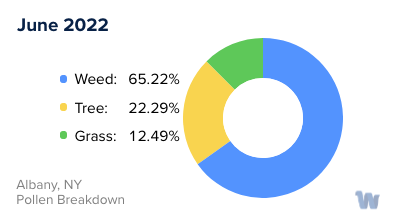
Weed
When is weed pollen highest in Albany, NY?
April has the highest weed pollen in Albany, NY with an average PPM of
When is weed pollen lowest in Albany, NY?
February has the lowest weed pollen in Albany, NY with an average PPM of
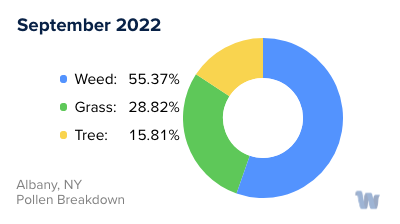
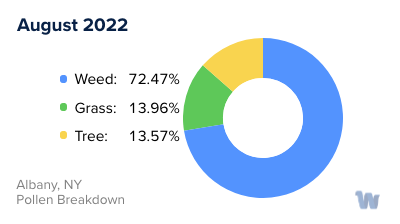
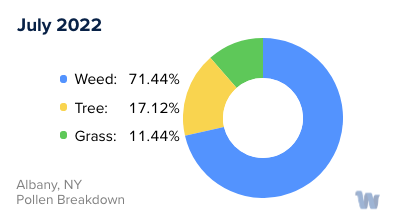
Albany, NY Pollen Monthly Breakdown by Pollen Type

Pollen and Hay Fever in Albany, NY
When it comes to pollen allergies and hay fever, Albany, New York is a city that has increasingly become a focal point. In fact, Albany was named one of the top 15 "pollen capitals" in the country by the Asthma and Allergy Foundation of America, signifying its heightened levels of pollen and its impact on the population.
In Albany, three main types of pollen tend to be the primary culprits when it comes to triggering allergies: tree pollen, grass pollen, and ragweed pollen. These types of pollen can vary in their intensity throughout the year, contributing to seasonal allergies or hay fever among residents.
Analyzing the trends in Albany over the years, it becomes clear that the seasons are not just getting warmer, they are also getting longer. Since 1970, the average spring temperature has risen by 2.4 degrees in Albany, with even more warming observed in the fall. The growing season, or the freeze-free period, has extended by six days compared to the previous 30-year period. This means that the season begins a day earlier in the spring and extends five days later into the fall.
What do these changes mean for those who suffer from pollen allergies? The warmer and longer seasons enable more pollen to be produced. As a result, the pollen season becomes more intense and drawn out, causing symptoms of hay fever and pollen allergies to be more severe and last for a longer period.
Furthermore, the changes in climate also mean that allergy-causing plants can grow in new areas, potentially exposing people to new allergens. This could mean that even if you didn't previously experience hay fever or pollen allergies, you might start experiencing symptoms due to exposure to these new types of pollen.
In conclusion, Albany's status as a "pollen capital," the diversity of pollen types, and the changing seasons all contribute to the trends of pollen allergies and hay fever in the city. As the city continues to evolve and respond to changes in climate, it's likely that these trends will continue to develop as well.