Indianapolis, IN Pollen and Allergy Report for Summer 2023

Pollen Allergy Trends in Indianapolis, IN
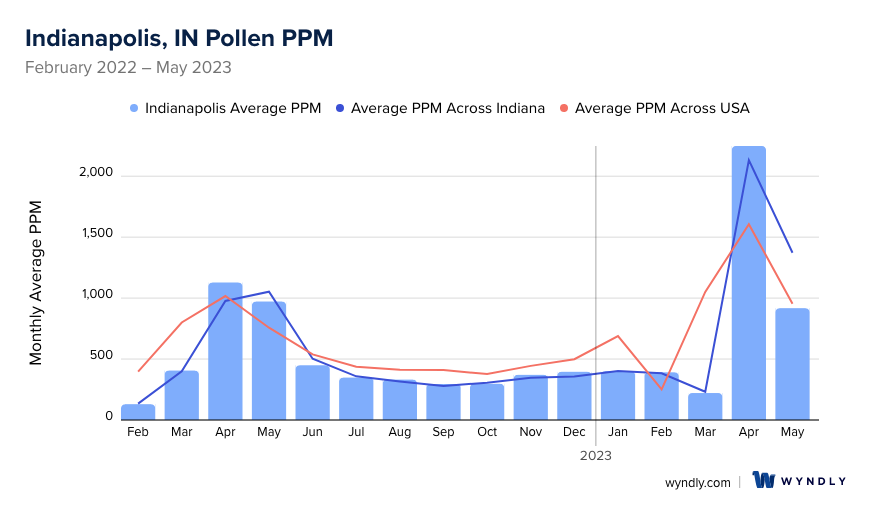
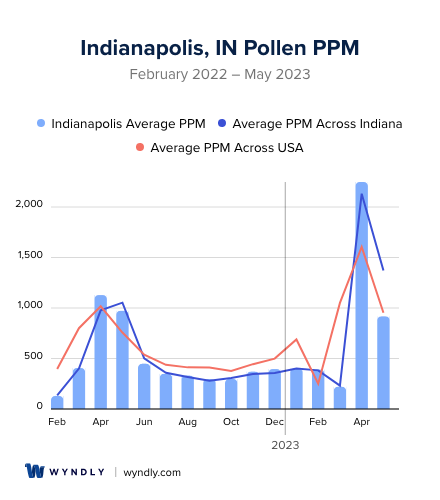
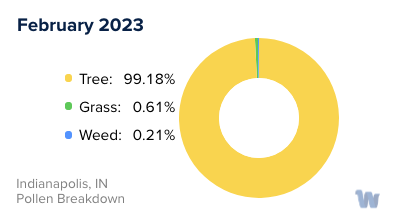
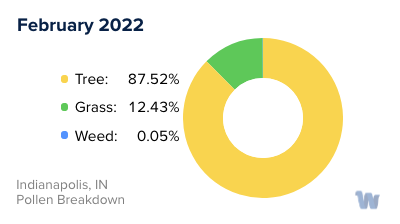
When is pollen lowest in Indianapolis, IN?
February
Lowest month total PPM
Avg. PPM
When is pollen highest in Indianapolis, IN?
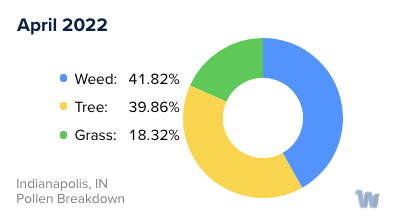
April
Highest month total PPM
Avg. PPM
How does pollen in Indianapolis, IN compare to Indiana?
Indianapolis has a lower average PPM than the state of Indiana.
Indianapolis yearly avg PPM:
Indiana yearly avg PPM:
How does pollen in Indianapolis, IN compare to the USA?
Indianapolis has a lower average PPM than the USA.
Indianapolis yearly avg PPM:
USA yearly avg PPM:
Is pollen worse this year in Indianapolis, IN?
Spring 2023 was worse than spring 2022.
Spring 2023 PPM:
Spring 2022 PPM:
Average PPM in Indianapolis, IN
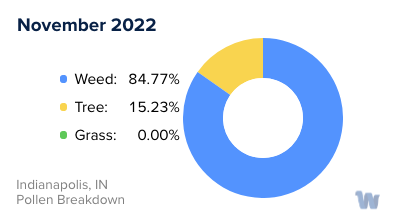
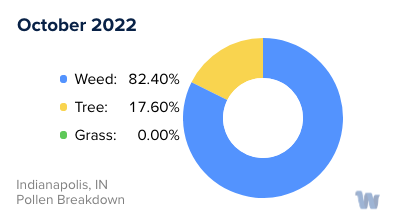
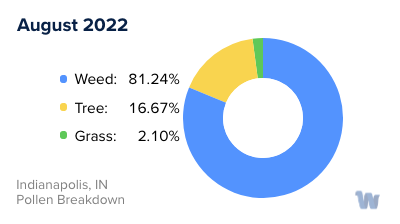
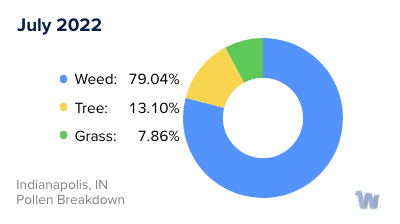
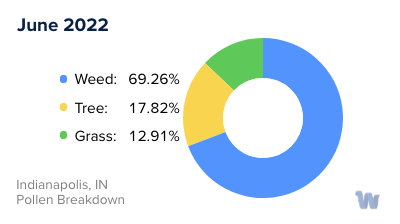
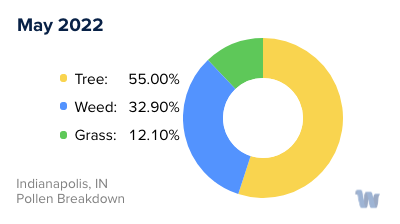
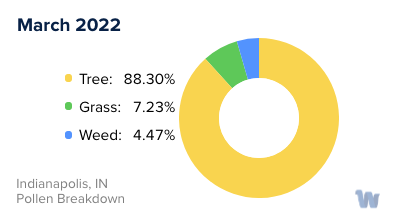
Indianapolis, IN Pollen and Allergy Breakdown by Month
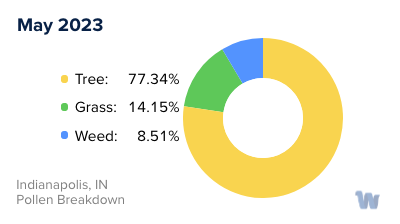
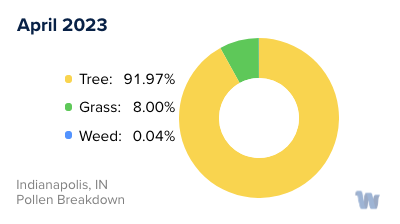
Grass
When is grass pollen highest in Indianapolis, IN?
April has the highest grass pollen in Indianapolis, IN with an average PPM of
When is grass pollen lowest in Indianapolis, IN?
October has the lowest grass pollen in Indianapolis, IN with an average PPM of
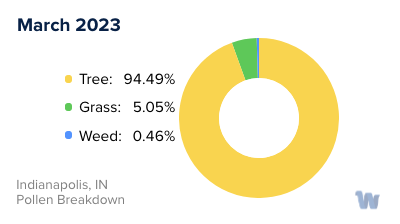
Tree
When is tree pollen highest in Indianapolis, IN?
April has the highest tree pollen in Indianapolis, IN with an average PPM of
When is tree pollen lowest in Indianapolis, IN?
July has the lowest tree pollen in Indianapolis, IN with an average PPM of
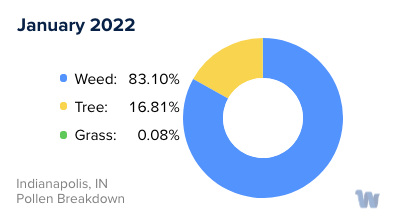
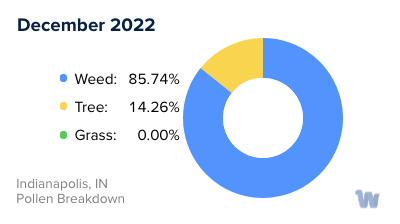
Weed
When is weed pollen highest in Indianapolis, IN?
April has the highest weed pollen in Indianapolis, IN with an average PPM of
When is weed pollen lowest in Indianapolis, IN?
February has the lowest weed pollen in Indianapolis, IN with an average PPM of
Indianapolis, IN Pollen Monthly Breakdown by Pollen Type

Pollen and Hay Fever in Indianapolis, IN
Pollen allergies, often referred to as hay fever, are a prevalent health concern in Indianapolis, Indiana. These allergies are the body's overzealous response to airborne pollen grains from various trees, grasses, and weeds. In the Crossroads of America, the primary culprits are tree pollen in the spring, grass pollen in late spring and early summer, and weed pollen in late summer and fall.
Beginning in the spring, the city hums with the bustle of blooming trees. Oak, maple, and pine are among the heavy hitters, releasing copious amounts of pollen that wafts through the air. This season is often the most challenging for allergy sufferers, as the concentration of pollen is particularly high.
As Indianapolis eases into late spring and early summer, the tree pollen subsides, making way for grass pollen. The common grasses in the region, such as Timothy, Kentucky bluegrass, and ryegrass, shed their microscopic particles, which can trigger allergic reactions. The wind can carry these tiny grains for miles, blanketing the city and causing an uptick in hay fever symptoms.
As summer wanes and the days shorten, another round of allergens takes center stage. Ragweed, a common weed in Indiana, begins its pollination. One ragweed plant can produce up to one billion pollen grains in a season, and these can travel vast distances on the wind. This makes late summer and early fall a trying time for many individuals sensitive to this type of pollen.
The pollen seasons in Indianapolis are predictable, but the severity can vary from year to year, influenced by factors such as winter's length and severity, rainfall amounts, and temperature patterns. It's important to remember that while these allergens can cause discomfort, they are a natural part of our environment. They play a crucial role in the reproduction of plants, contributing to the lush landscapes and beautiful green spaces that make Indianapolis so special.