Glendale, CA Pollen and Allergy Report for Summer 2023

Pollen Allergy Trends in Glendale, CA
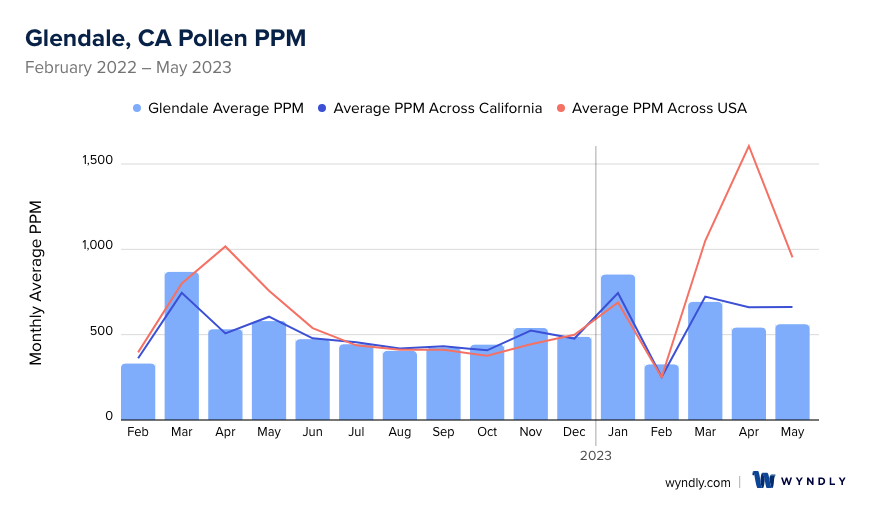
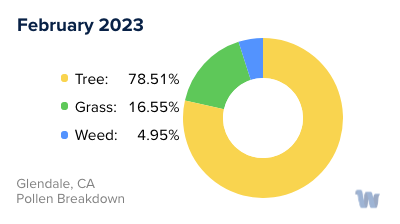
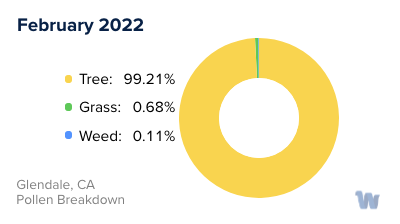
When is pollen lowest in Glendale, CA?
February
Lowest month total PPM
Avg. PPM
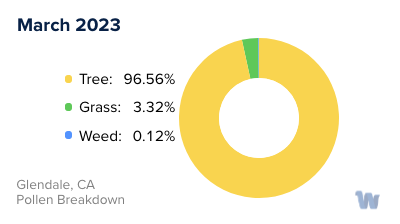
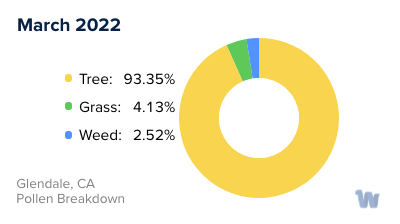
When is pollen highest in Glendale, CA?
March
Highest month total PPM
Avg. PPM
How does pollen in Glendale, CA compare to California?
Glendale has a higher average PPM than the state of California.
Glendale yearly avg PPM:
California yearly avg PPM:
How does pollen in Glendale, CA compare to the USA?
Glendale has a lower average PPM than the USA.
Glendale yearly avg PPM:
USA yearly avg PPM:
Is pollen worse this year in Glendale, CA?
Spring 2023 was better than spring 2022.
Spring 2023 PPM:
Spring 2022 PPM:
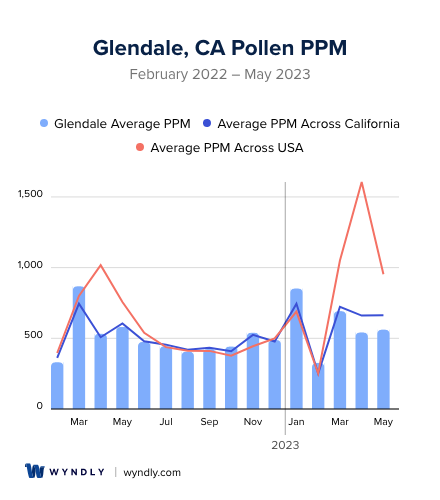
Average PPM in Glendale, CA
Glendale, CA Pollen and Allergy Breakdown by Month
Grass
When is grass pollen highest in Glendale, CA?
May has the highest grass pollen in Glendale, CA with an average PPM of
When is grass pollen lowest in Glendale, CA?
December has the lowest grass pollen in Glendale, CA with an average PPM of
Tree
When is tree pollen highest in Glendale, CA?
March has the highest tree pollen in Glendale, CA with an average PPM of
When is tree pollen lowest in Glendale, CA?
August has the lowest tree pollen in Glendale, CA with an average PPM of
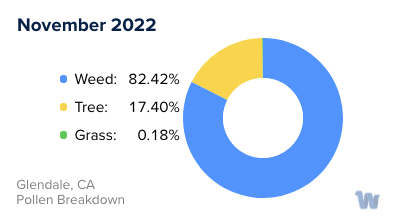
Weed
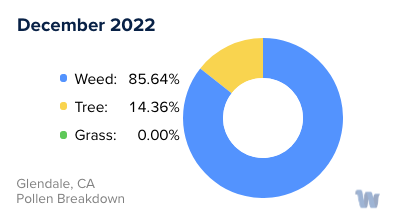
When is weed pollen highest in Glendale, CA?
November has the highest weed pollen in Glendale, CA with an average PPM of
When is weed pollen lowest in Glendale, CA?
February has the lowest weed pollen in Glendale, CA with an average PPM of
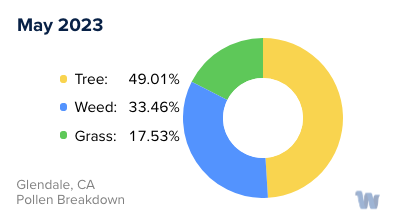
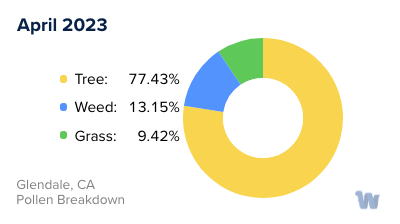
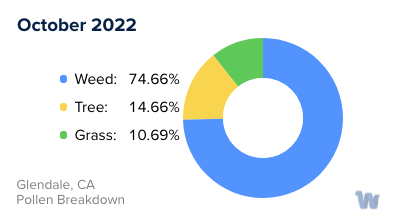
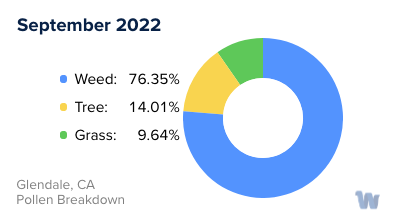
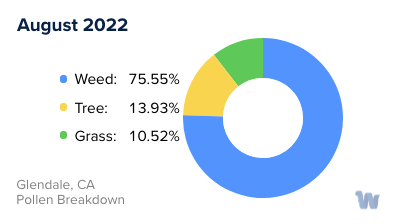
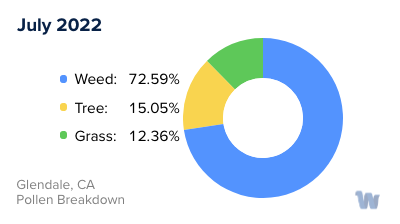
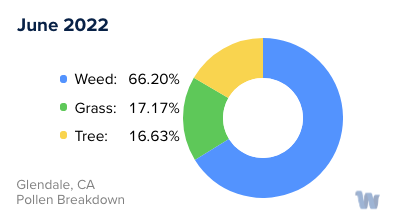
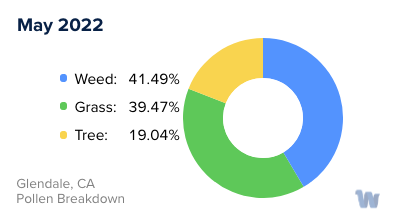
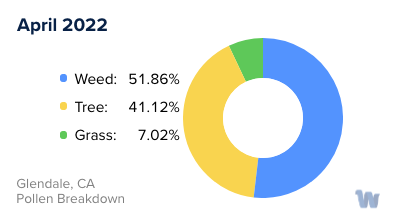
Glendale, CA Pollen Monthly Breakdown by Pollen Type
Pollen and Hay Fever in Glendale, CA
If you're living in Glendale, California, you're no stranger to the beauty of blooming flowers and lush greenery that adorn the city. However, with this natural splendor comes a less delightful phenomenon: pollen allergies, also known as hay fever.
Pollen is a powdery substance comprising microscopic grains discharged from the male part of a flower or from a male cone. Each type of plant in Glendale produces a unique kind of pollen, and not all are created equal when it comes to causing allergies. Some people might find themselves sneezing around one type of plant but perfectly fine around another.
In Glendale, the trees that most commonly cause pollen allergies include oak, ash, pine, and cedar. These trees tend to pollinate in the spring. During this time, the air can be thick with microscopic particles, causing hay fever symptoms to flare.
Grass pollen can also be a significant allergen and is usually in abundance during the late spring and early summer. Common grasses in Glendale that produce allergy-causing pollen include ryegrass and Timothy grass.
Weeds are another source of allergenic pollen. In Glendale, ragweed, sagebrush, and pigweed are common culprits. These plants often bloom in the late summer and fall, meaning hay fever season can extend well into the year for some residents.
It's important to remember that weather conditions can significantly impact pollen levels. Warm, windy days can cause pollen to spread, while rain can help clear it from the air.
Pollen allergies are a significant part of life in Glendale, with each season bringing its unique combination of allergenic plants. By understanding the types of pollen in the air and their seasons, residents can better anticipate and navigate the challenges of hay fever, helping them to enjoy the beautiful outdoors of Glendale in a more comfortable manner.