Murrieta, CA Pollen and Allergy Report for Summer 2023

Pollen Allergy Trends in Murrieta, CA
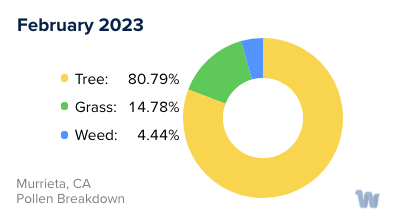
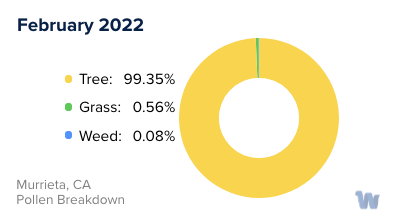
When is pollen lowest in Murrieta, CA?
February
Lowest month total PPM
Avg. PPM
When is pollen highest in Murrieta, CA?
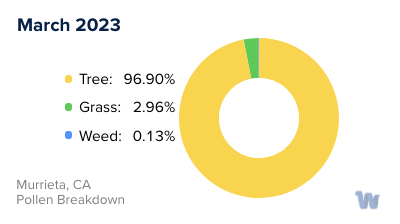
March
Highest month total PPM
Avg. PPM
How does pollen in Murrieta, CA compare to California?
Murrieta has a lower average PPM than the state of California.
Murrieta yearly avg PPM:
California yearly avg PPM:
How does pollen in Murrieta, CA compare to the USA?
Murrieta has a lower average PPM than the USA.
Murrieta yearly avg PPM:
USA yearly avg PPM:
Is pollen worse this year in Murrieta, CA?
Spring 2023 was better than spring 2022.
Spring 2023 PPM:
Spring 2022 PPM:
Average PPM in Murrieta, CA
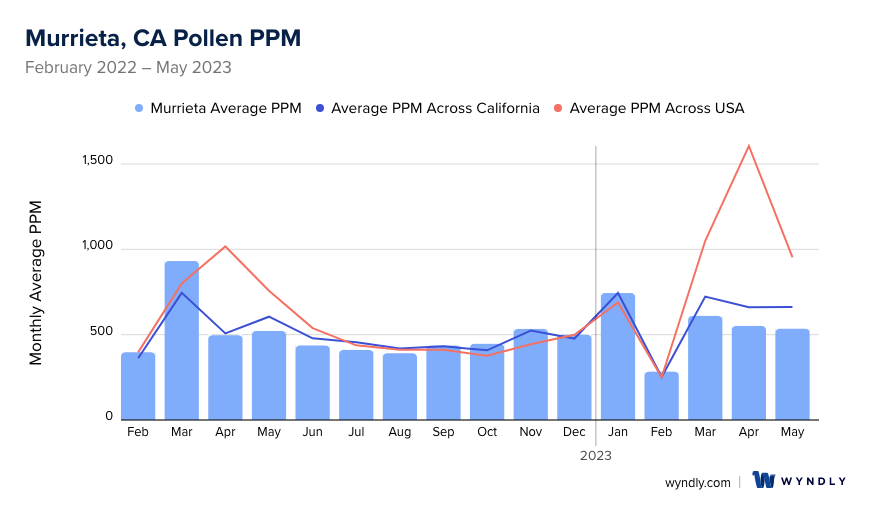
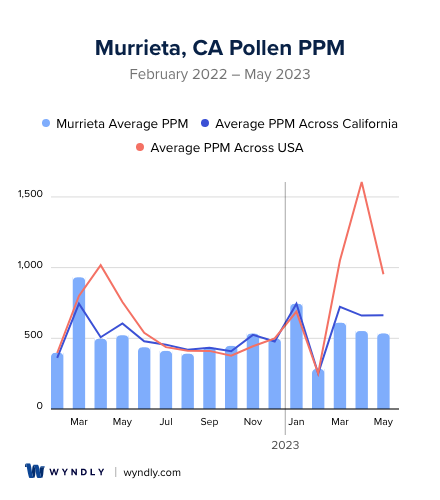
Murrieta, CA Pollen and Allergy Breakdown by Month
Grass
When is grass pollen highest in Murrieta, CA?
May has the highest grass pollen in Murrieta, CA with an average PPM of
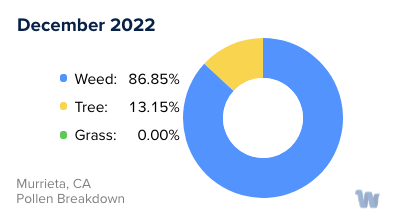
When is grass pollen lowest in Murrieta, CA?
December has the lowest grass pollen in Murrieta, CA with an average PPM of
Tree
When is tree pollen highest in Murrieta, CA?
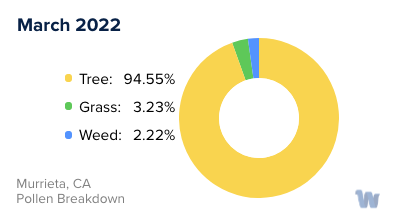
March has the highest tree pollen in Murrieta, CA with an average PPM of
When is tree pollen lowest in Murrieta, CA?
July has the lowest tree pollen in Murrieta, CA with an average PPM of
Weed
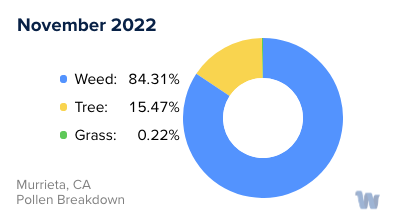
When is weed pollen highest in Murrieta, CA?
November has the highest weed pollen in Murrieta, CA with an average PPM of
When is weed pollen lowest in Murrieta, CA?
February has the lowest weed pollen in Murrieta, CA with an average PPM of
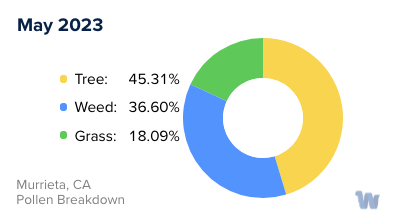
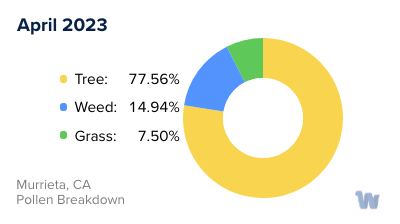
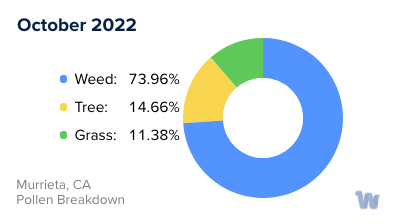
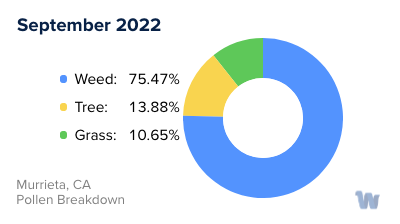
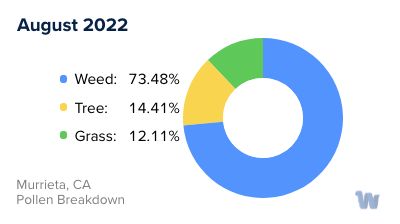
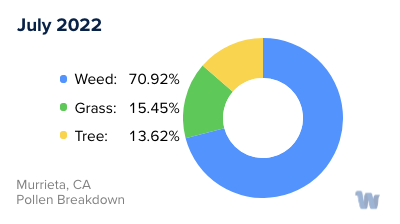
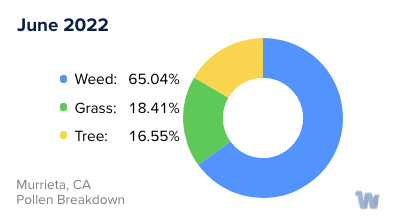
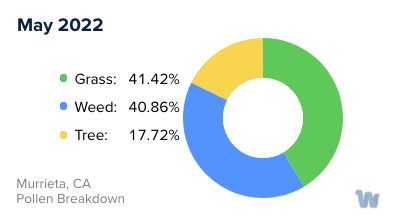
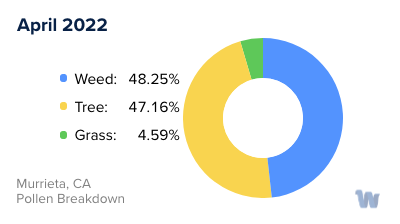
Murrieta, CA Pollen Monthly Breakdown by Pollen Type

Pollen and Hay Fever in Murrieta, CA
Pollen allergies, often referred to as hay fever, can be a real concern for the residents of Murrieta, California. The primary culprits are usually grasses, trees, and weeds, with each type of pollen varying in its impact throughout the year.
In the Golden State, the allergy season starts around late January and concludes in early October, significantly longer than in some other states. This extended season is primarily due to California's mild winter climate, which is somewhat beneficial to allergy sufferers as it results in a more evenly spread pollen dispersion rather than a sudden, overwhelming burst.
Murrieta's pollen count, a measure of pollen density in the air, can track all types of pollen or focus on specific ones. For example, tree pollen may be low on a given day, but grass or ragweed pollen could be high, potentially impacting those with specific allergies.
A three-day outlook could reveal that tree and ragweed pollen levels are low, while grass pollen levels are set to rise. This fluctuating pollen landscape underscores the importance of tracking pollen counts for those with allergies.
It's crucial to note that allergy symptoms can occur at any time of year, but pollen allergies tend to flare up in the spring, summer, and fall. In California, pollen counts typically peak in April, May, and September. During these months, pollen levels can be lower in the evenings, so it may be beneficial to plan outdoor activities accordingly.
Common allergens in California include bluegrass, ryegrass, sagebrush, ragweed, and Russian thistle among others. Tree allergens can come from a variety of sources, such as oak, olive, ash, cedar, eucalyptus, and mulberry. Each of these allergens has its unique seasonal pattern, adding to the overall pollen count.
In conclusion, pollen allergies in Murrieta, California are a seasonal concern primarily driven by the local flora and climate. Awareness of the types of pollen and their seasonal patterns can help residents better anticipate and navigate the allergy season.