El Monte, CA Pollen and Allergy Report for Summer 2023

Pollen Allergy Trends in El Monte, CA

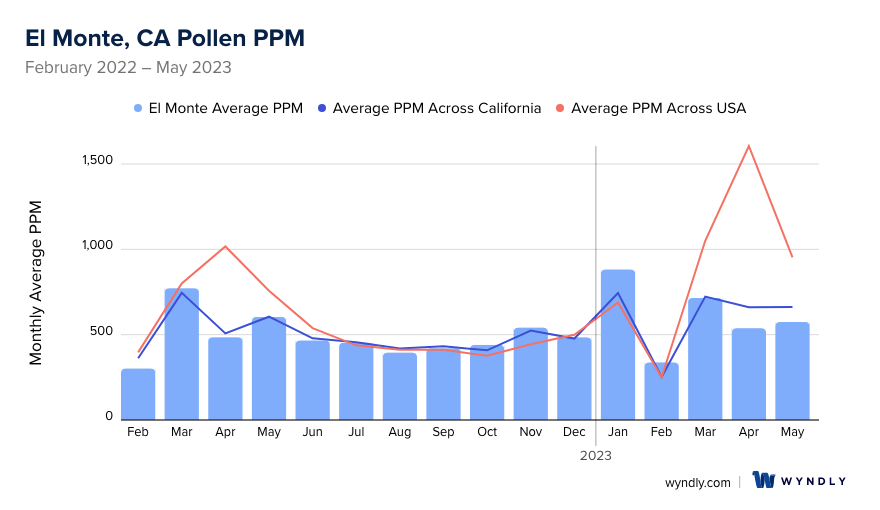
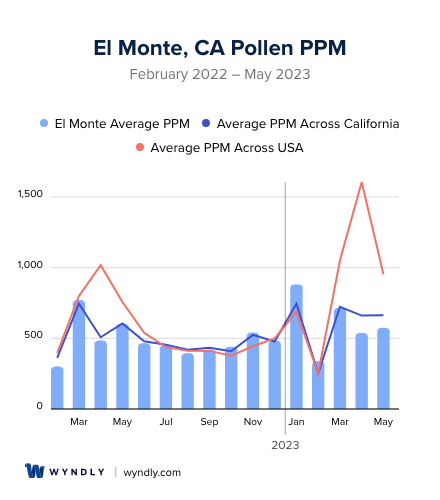
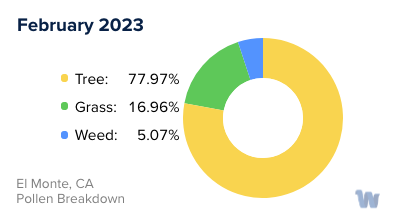
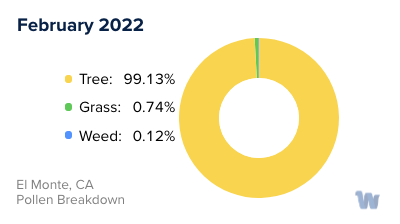
When is pollen lowest in El Monte, CA?

Green down arrow

February

Lowest month total PPM

301.36 Avg. PPM

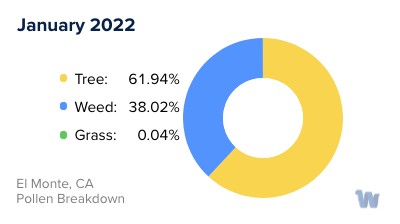
When is pollen highest in El Monte, CA?

Red up arrow

January

Highest month total PPM

881.76 Avg. PPM

How does pollen in El Monte, CA compare to California?

El Monte has a lower average PPM than the state of California.

El Monte yearly avg PPM: 525.26

California yearly avg PPM: 528.52

How does pollen in El Monte, CA compare to the USA?

El Monte has a lower average PPM than the USA.

El Monte yearly avg PPM: 525.26

USA yearly avg PPM: 664.86

Is pollen worse this year in El Monte, CA?

Spring 2023 was about the same as 2022.

Spring 2023 PPM: 1,826.75

Spring 2022 PPM: 1,859.32

Average PPM in El Monte, CA

El Monte, CA Average PPM El Monte, CA Average PPM

El Monte, CA Pollen and Allergy Breakdown by Month
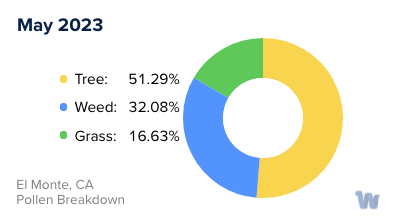
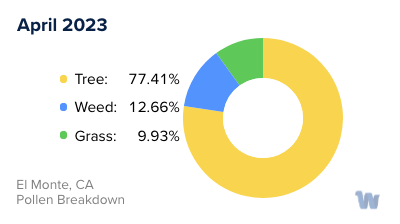
Grass

When is grass pollen highest in El Monte, CA?

May has the highest grass pollen in El Monte, CA with an average PPM of 242.66

When is grass pollen lowest in El Monte, CA?

December has the lowest grass pollen in El Monte, CA with an average PPM of
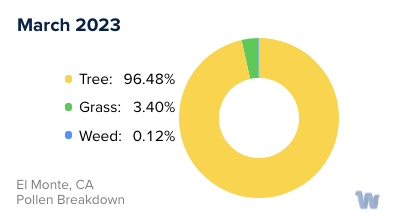
 0

Tree

When is tree pollen highest in El Monte, CA?

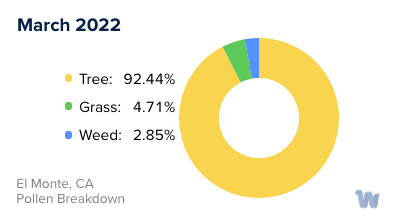
March has the highest tree pollen in El Monte, CA with an average PPM of 713.38

When is tree pollen lowest in El Monte, CA?

August has the lowest tree pollen in El Monte, CA with an average PPM of
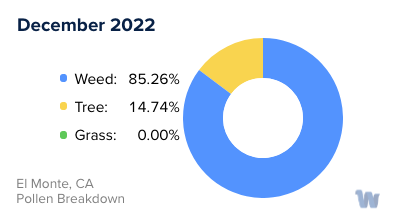
 56.33

Weed

When is weed pollen highest in El Monte, CA?

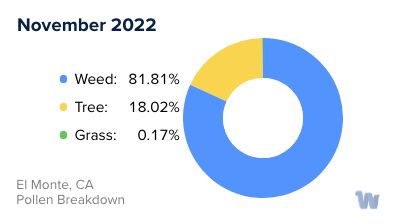
November has the highest weed pollen in El Monte, CA with an average PPM of 442.67

When is weed pollen lowest in El Monte, CA?

February has the lowest weed pollen in El Monte, CA with an average PPM of 0.37

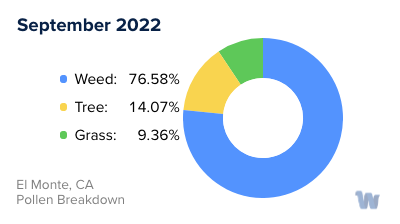
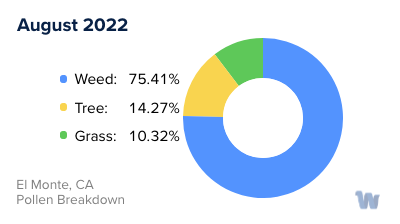
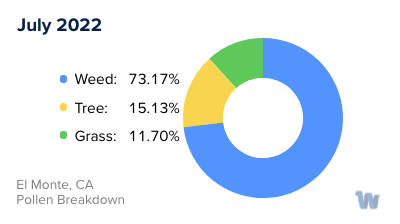
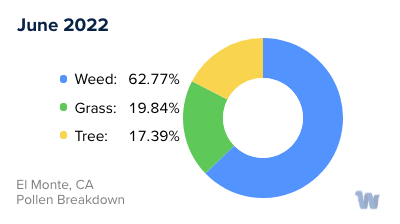
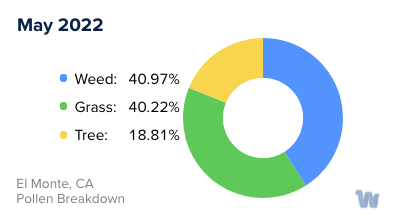
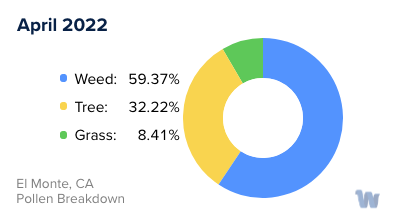
El Monte, CA Pollen Monthly Breakdown by Pollen Type

El Monte, CA Monthly Pollen Breakdown

Pollen and Hay Fever in El Monte, CA

In El Monte, California, allergies driven by various types of pollen can significantly affect the quality of life. This charming city isn't immune to the seasonal bouts of sneezing, itching, and watery eyes known as hay fever or pollen allergies.

Pollen, tiny particles released by plants for reproduction, is the primary trigger of these allergies. In El Monte, common culprits include tree pollens. Specific trees such as oak, olive, ash, cedar, and eucalyptus are common allergens in the area.

In California, the allergy season is influenced by the state's diverse geographical regions, each having different allergens and allergy seasons. For El Monte, situated in the Coastal & Central California region, the allergy season typically starts around late January and extends until early October.

It's worth noting that the intensity of pollen allergies varies throughout the season. You may feel the greatest impact during peak times, generally in April, May, and September, when pollen counts are typically highest.

Seasonal allergies commonly start in late January due to California's milder winter. This results in a slightly longer allergy season compared to other states, but the temperate climate of California can make the allergy season a bit more manageable for sufferers.

While the winter months in California offer a reprieve from outdoor allergens, indoor allergens can still cause issues, especially as people spend more time indoors. However, this discussion is focused on pollen allergies, not indoor allergens.

Understanding the types of pollen and the timing of the seasons can help residents of El Monte anticipate and prepare for the pollen allergy season, ensuring they can make the most of the city's vibrant life throughout the year.

El Monte, CA Map

What is Wyndly?

Wyndly is the easiest and most convenient way to fix your allergies forever. As an online allergy practice, Wyndly offers at-home allergy testing and treatment. The main goal of Wyndly is to retrain the immune system to stop responding to allergens, providing lasting relief from allergies.

Here's how Wyndly works:

  1. Identify Allergy Triggers: The first step is to identify the allergy triggers. You can purchase an at-home allergy test from Wyndly, or if you have already done an allergy test elsewhere, you can share your existing test results. This allows the doctors at Wyndly to pinpoint which allergies need to be treated.
  2. Get Treated by a Real Doctor: Using medications that are similar to those used in allergy shots, a doctor creates a unique sublingual immunotherapy treatment plan to desensitize your immune system. This is done using FDA-approved sublingual tablets or clinically proven dosing for oral use.
  3. Live Better Without Symptoms: The prescriptions are shipped to your door, and the doctor works with you until you’re better. Wyndly offers regular online check-ins with US-licensed physicians and 24/7 availability for questions or concerns via text, email, or call.

The treatment plans are personalized based on your specific allergy triggers and aim to treat allergies at their source, rather than just relieving symptoms for a short period. Most people report improvement in as little as one month.

Start with Wyndly today

Wyndly Summer 2023 Pollen Report Methodology

For each city, Wyndly obtained monthly pollen PPMs (pollen grains per cubic meter) for each form (tree, grass, and weed) from February 2022 - May 2023. Data were obtained from Pollen Sense, LLC Automated Particulate Sensors (APS). These sensors automatically detect particulate matter collected from ambient air, and use a neural network algorithm to identify individual pollen species and calculate daily pollen counts.

Yearly averages are calculated by summing the three allergen averages per month of data for a total monthly PPM, summing all monthly total PPMs, then dividing by 12 (month count). Used for per-city average, state average, and total USA average. Season comparisons are done by summing the months of Spring (March, April, May) for 2023 and 2022. If the absolute of the (2023-2022)/2022 is ≤ 0.05, the years were about the same. Otherwise, the more PPM, the worse the season was.

Is Wyndly right for you?

Answer just a few questions and we'll help you find out.

Get Started Today

Pollen and Allergy Reports by City