Bellevue, WA Pollen and Allergy Report for Summer 2023

Pollen Allergy Trends in Bellevue, WA
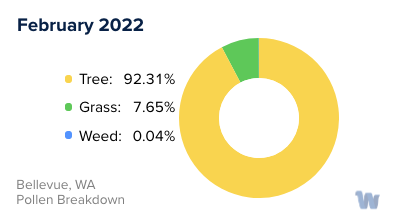
When is pollen lowest in Bellevue, WA?
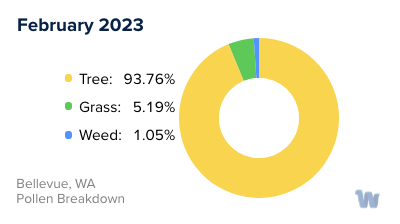
February
Lowest month total PPM
Avg. PPM
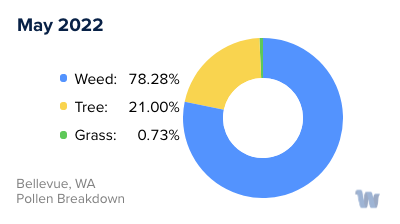
When is pollen highest in Bellevue, WA?
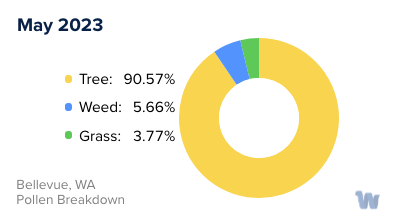
May
Highest month total PPM
Avg. PPM
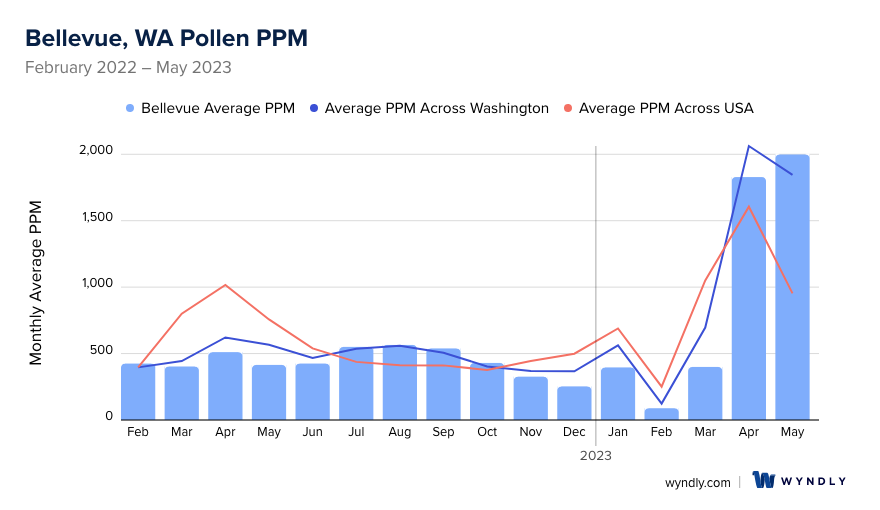
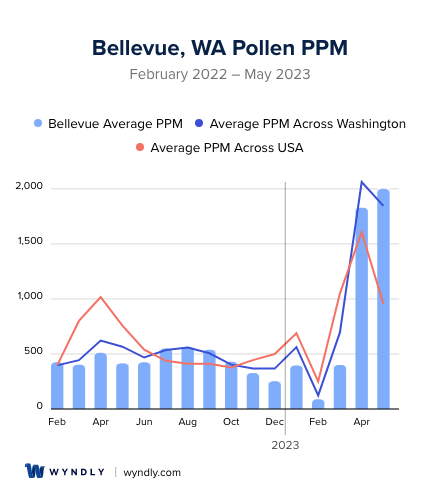
How does pollen in Bellevue, WA compare to Washington?
Bellevue has a lower average PPM than the state of Washington.
Bellevue yearly avg PPM:
Washington yearly avg PPM:
How does pollen in Bellevue, WA compare to the USA?
Bellevue has a lower average PPM than the USA.
Bellevue yearly avg PPM:
USA yearly avg PPM:
Is pollen worse this year in Bellevue, WA?
Spring 2023 was worse than spring 2022.
Spring 2023 PPM:
Spring 2022 PPM:
Average PPM in Bellevue, WA
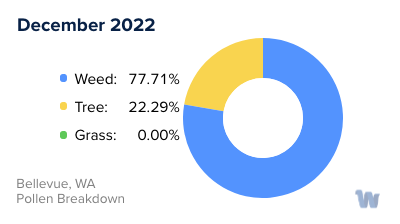
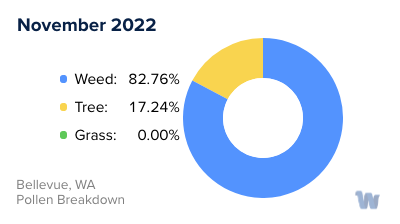
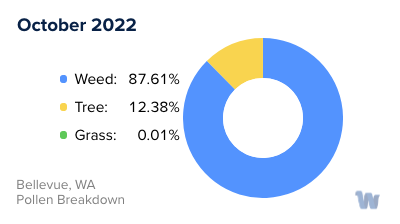
Bellevue, WA Pollen and Allergy Breakdown by Month
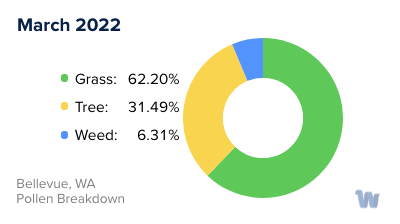
Grass
When is grass pollen highest in Bellevue, WA?
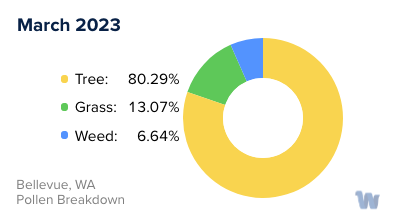
March has the highest grass pollen in Bellevue, WA with an average PPM of
When is grass pollen lowest in Bellevue, WA?
November has the lowest grass pollen in Bellevue, WA with an average PPM of
Tree
When is tree pollen highest in Bellevue, WA?
May has the highest tree pollen in Bellevue, WA with an average PPM of
When is tree pollen lowest in Bellevue, WA?
April has the lowest tree pollen in Bellevue, WA with an average PPM of
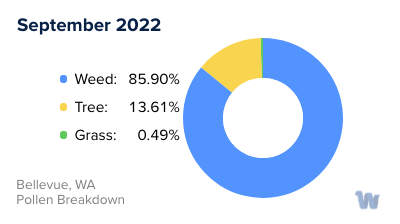
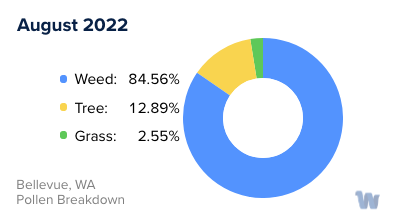
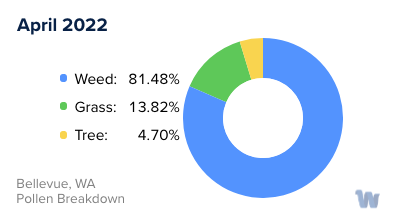
Weed
When is weed pollen highest in Bellevue, WA?
August has the highest weed pollen in Bellevue, WA with an average PPM of
When is weed pollen lowest in Bellevue, WA?
February has the lowest weed pollen in Bellevue, WA with an average PPM of
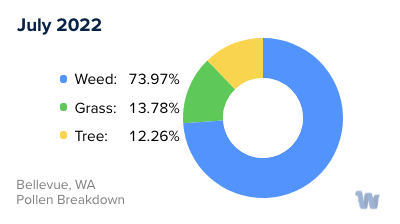
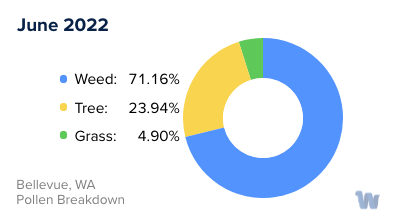
Bellevue, WA Pollen Monthly Breakdown by Pollen Type


Pollen and Hay Fever in Bellevue, WA
Pollen allergies, often referred to as hay fever, are a common concern for many residents of Bellevue, Washington. With the city's rich, natural environment comes a substantial presence of pollen, a microscopic powder released by plants for reproduction. Pollen counts, or the number of pollen grains present per cubic meter of air, are regularly monitored in the region, providing valuable information about potential allergen levels in the air.
In Bellevue, three primary types of pollen contribute to allergies: tree, grass, and weed pollen. Each of these has a specific period of the year when their levels peak, referred to as the pollen season.
Tree pollen is typically the first to appear as spring sets in, with trees such as pine, birch, cedar, elm, cottonwood, and magnolia releasing large quantities of pollen into the air. These trees release pollen to fertilize other trees of the same species, but the lightweight pollen can easily be carried by the wind, making it a common trigger for hay fever symptoms.
As spring turns to summer, grass pollen takes over as the main allergen. While the concentration is less than that of tree pollen, grass pollen can still lead to considerable discomfort for those with sensitivities or allergies. Bellevue sees a rise in grass pollen levels from May to June.
Lastly, weed pollen becomes predominant from late summer until September. Weed plants like nettle release their pollen later in the year, meaning that hay fever sufferers may experience symptoms well into the fall.
Understanding the types of pollen and their respective seasons can be very helpful in managing hay fever symptoms. Residents can use local resources such as the Northwest Asthma & Allergy Center's pollen counts to stay informed about current allergen levels and better anticipate their individual needs during these high pollen seasons.