Baton Rouge, LA Pollen and Allergy Report for Summer 2023

Pollen Allergy Trends in Baton Rouge, LA
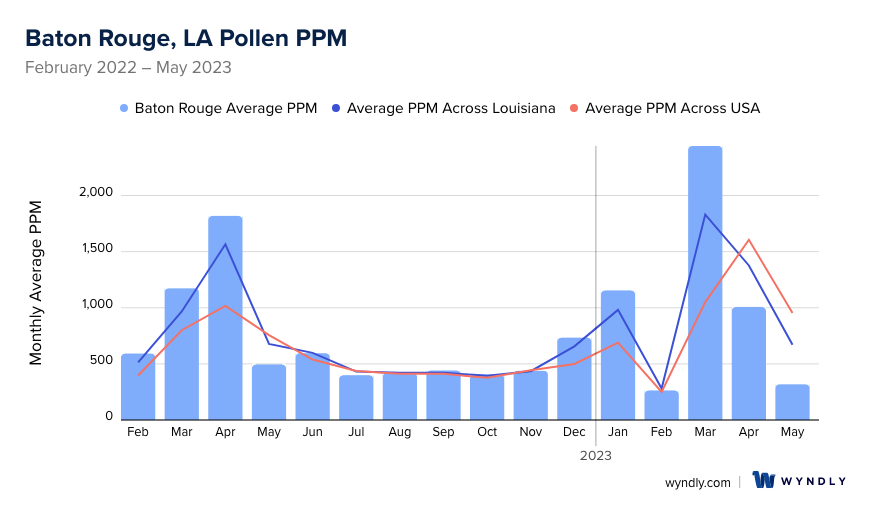
When is pollen lowest in Baton Rouge, LA?
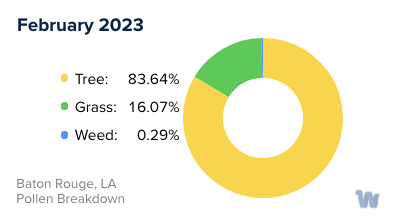
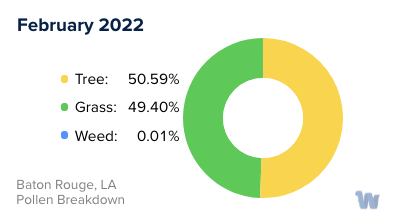
February
Lowest month total PPM
Avg. PPM
When is pollen highest in Baton Rouge, LA?
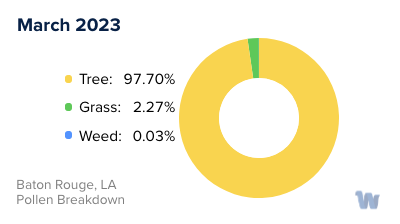
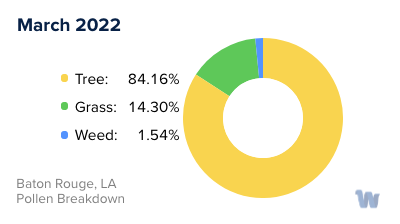
March
Highest month total PPM
Avg. PPM
How does pollen in Baton Rouge, LA compare to Louisiana?
Baton Rouge has a higher average PPM than the state of Louisiana.
Baton Rouge yearly avg PPM:
Louisiana yearly avg PPM:
How does pollen in Baton Rouge, LA compare to the USA?
Baton Rouge has a higher average PPM than the USA.
Baton Rouge yearly avg PPM:
USA yearly avg PPM:
Is pollen worse this year in Baton Rouge, LA?
Spring 2023 was worse than spring 2022.
Spring 2023 PPM:
Spring 2022 PPM:
Average PPM in Baton Rouge, LA
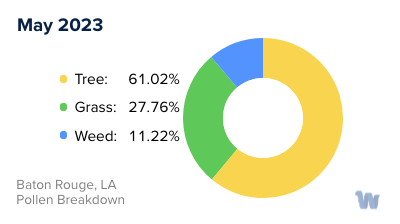
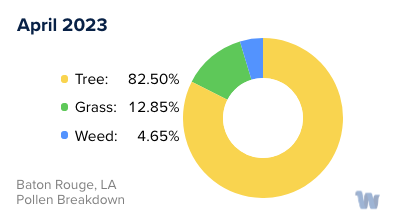
Baton Rouge, LA Pollen and Allergy Breakdown by Month
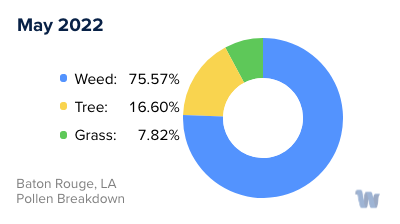
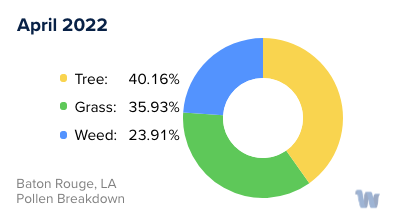
Grass
When is grass pollen highest in Baton Rouge, LA?
April has the highest grass pollen in Baton Rouge, LA with an average PPM of
When is grass pollen lowest in Baton Rouge, LA?
December has the lowest grass pollen in Baton Rouge, LA with an average PPM of
Tree
When is tree pollen highest in Baton Rouge, LA?
March has the highest tree pollen in Baton Rouge, LA with an average PPM of
When is tree pollen lowest in Baton Rouge, LA?
July has the lowest tree pollen in Baton Rouge, LA with an average PPM of
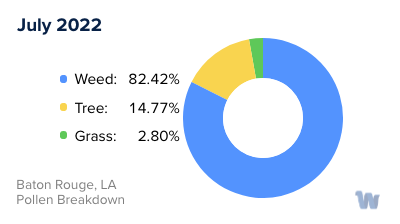
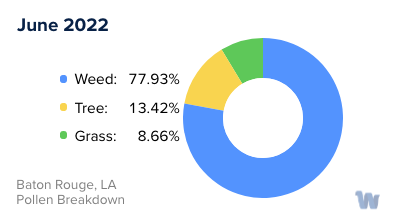
Weed
When is weed pollen highest in Baton Rouge, LA?
June has the highest weed pollen in Baton Rouge, LA with an average PPM of
When is weed pollen lowest in Baton Rouge, LA?
February has the lowest weed pollen in Baton Rouge, LA with an average PPM of
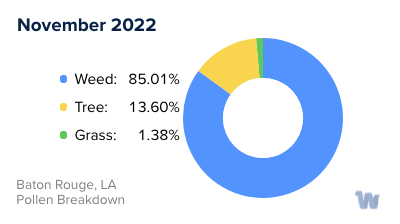
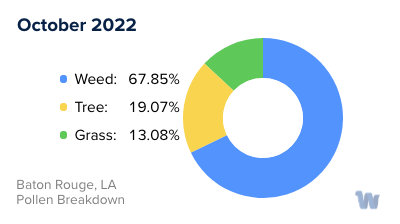
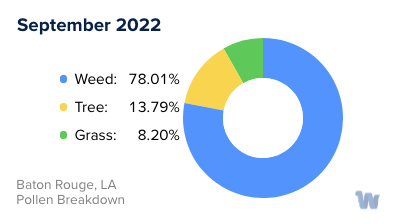
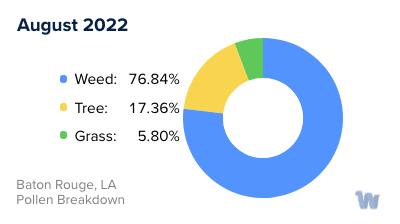
Baton Rouge, LA Pollen Monthly Breakdown by Pollen Type
Pollen and Hay Fever in Baton Rouge, LA
When spring and summer roll around in Baton Rouge, Louisiana, residents anticipate longer days, blooming flowers, and the resurgence of greenery. However, for many, these seasonal changes bring with them the less welcome arrival of hay fever, also known as pollen allergies.
Pollen allergies are triggered by the tiny, microscopic particles released by plants for fertilization. These particles, while harmless to many, can cause an immune response in those with allergies, leading to the classic symptoms of hay fever: itchy, watery eyes, a runny nose, and frequent sneezing.
In Baton Rouge, the pollen season is typically divided into three main parts: tree pollen season, grass pollen season, and weed pollen season. Each presents its own challenges for allergy sufferers.
Tree pollen season typically begins in late winter and extends into spring. Oak, pine, and cedar are the primary culprits in Baton Rouge. These trees release large quantities of pollen that can travel significant distances on the wind, often leading to high pollen counts in the area.
As tree pollen season winds down, grass pollen season begins. Starting in late spring and continuing through early summer, grasses such as Bermuda grass, ryegrass, and Timothy grass release their pollen, contributing to the ongoing plight of allergy sufferers.
Finally, as summer transitions into fall, weed pollen season begins. Ragweed is the most common source of weed pollen in Baton Rouge, but other plants like pigweed and sagebrush also contribute to the local pollen counts.
While each season brings its own mix of pollens, it's important to note that the specific timing and severity of each pollen season can vary from year to year, influenced by factors such as weather conditions, precipitation levels, and temperature. Despite these variations, understanding the general pollen cycle in Baton Rouge can help residents better anticipate and prepare for the challenges of hay fever.