Lewisville, TX Pollen and Allergy Report for Summer 2023

Pollen Allergy Trends in Lewisville, TX

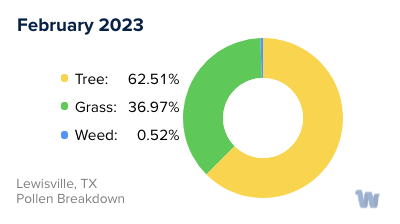
When is pollen lowest in Lewisville, TX?
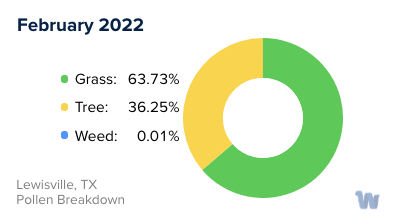
Green down arrow

February

Lowest month total PPM

155.48 Avg. PPM

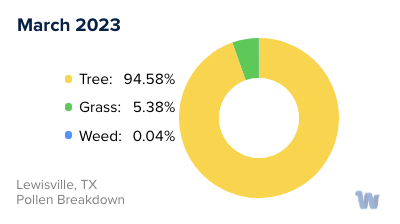
When is pollen highest in Lewisville, TX?
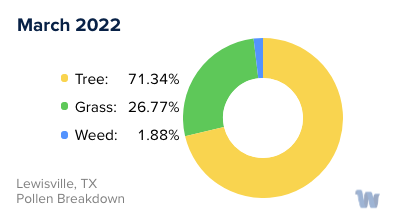
Red up arrow

March

Highest month total PPM

2,149.7 Avg. PPM

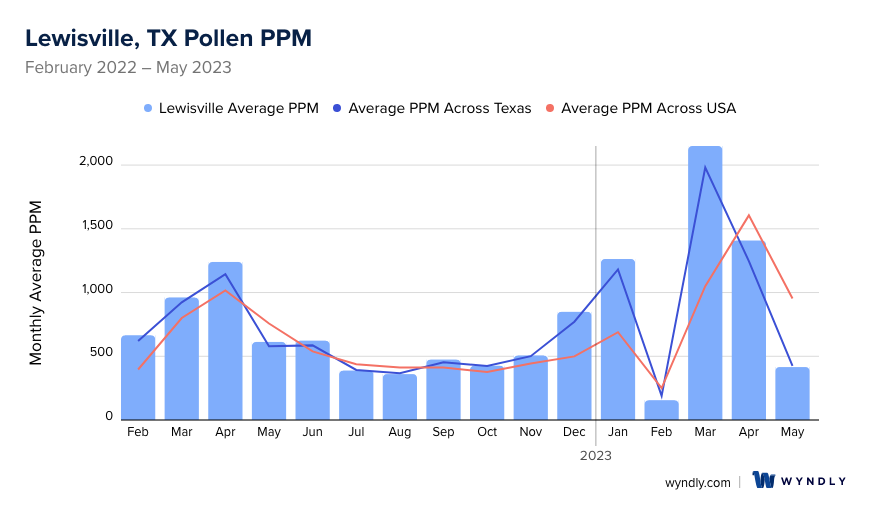
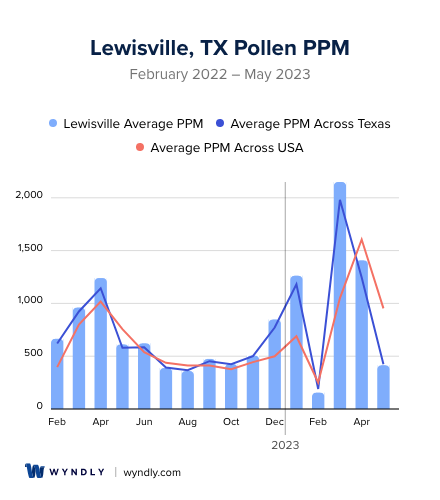
How does pollen in Lewisville, TX compare to Texas?

Lewisville has a higher average PPM than the state of Texas.

Lewisville yearly avg PPM: 781

Texas yearly avg PPM: 736.51

How does pollen in Lewisville, TX compare to the USA?

Lewisville has a higher average PPM than the USA.

Lewisville yearly avg PPM: 781

USA yearly avg PPM: 664.86

Is pollen worse this year in Lewisville, TX?

Spring 2023 was worse than spring 2022.

Spring 2023 PPM: 3,973.08

Spring 2022 PPM: 2,813.87

Average PPM in Lewisville, TX

Lewisville, TX Average PPM Lewisville, TX Average PPM

Lewisville, TX Pollen and Allergy Breakdown by Month

Grass

When is grass pollen highest in Lewisville, TX?

February has the highest grass pollen in Lewisville, TX with an average PPM of 423.79

When is grass pollen lowest in Lewisville, TX?

December has the lowest grass pollen in Lewisville, TX with an average PPM of 0

Tree

When is tree pollen highest in Lewisville, TX?

March has the highest tree pollen in Lewisville, TX with an average PPM of 2,033.2

When is tree pollen lowest in Lewisville, TX?

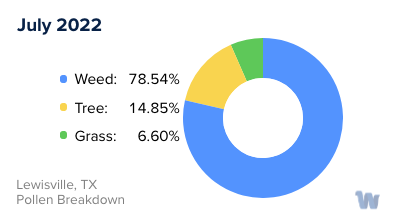
July has the lowest tree pollen in Lewisville, TX with an average PPM of
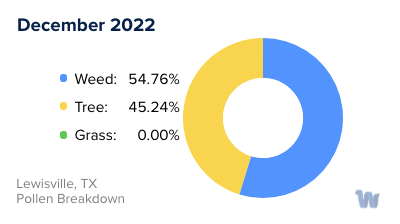
 57.64

Weed

When is weed pollen highest in Lewisville, TX?

December has the highest weed pollen in Lewisville, TX with an average PPM of 464.64

When is weed pollen lowest in Lewisville, TX?

February has the lowest weed pollen in Lewisville, TX with an average PPM of 0.07

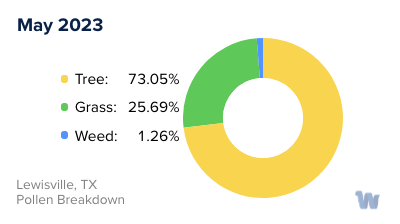
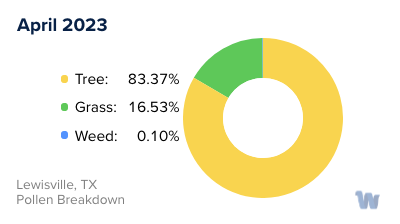
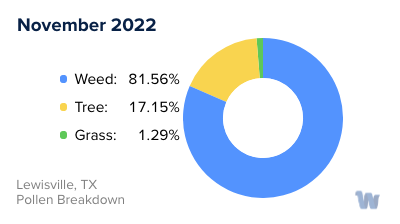
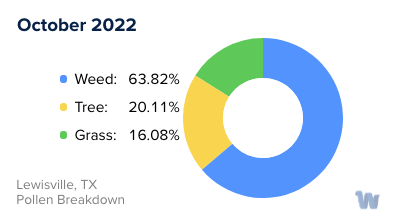
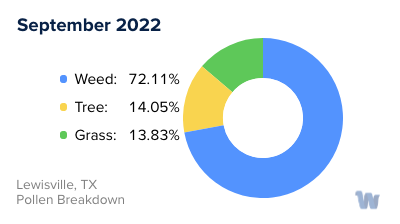
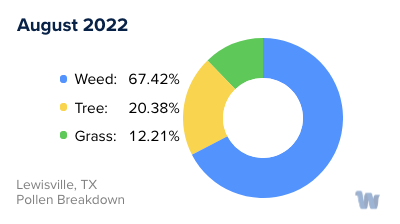
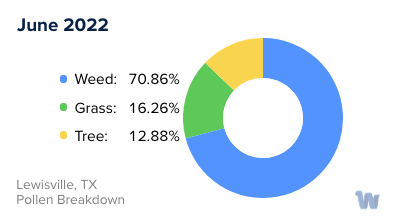
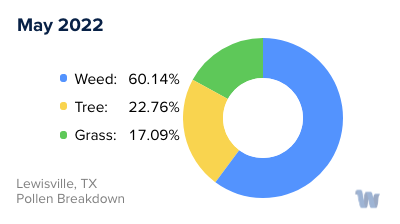
Lewisville, TX Pollen Monthly Breakdown by Pollen Type

Lewisville, TX Monthly Pollen Breakdown

Pollen and Hay Fever in Lewisville, TX

Pollen allergies, also known as hay fever or allergic rhinitis, are a significant concern for residents of Lewisville, Texas. The primary producers of pollen in the area include a variety of grasses, trees, and weeds. The mix of allergens in the air varies with the seasons, but people may experience symptoms at any time of the year.

In terms of grasses, Bermuda grass, Timothy grass, and Sweet vernal grass are some of the most common culprits. Trees such as Oak, Elm, Ash, Pecan, Cottonwood, and especially Cedar, are significant contributors to the pollen count. Ragweed, a weed, is another common allergen in the region.

The timing of pollen release generally follows a cycle in Lewisville. Spring, summer, and fall are typically when pollen allergies are most likely to flare up. However, because of Texas's warm weather and the prevalence of certain types of pollen, such as that from the Cedar tree, Texans rarely get a break from their seasonal allergies. Even winter can pose challenges due to Cedar fever and indoor allergens.

It's crucial to be aware of the pollen count throughout the year, but especially in December, January, May, and September. These months are when seasonal allergies are typically at their peak. During these periods, the evening hours may offer some relief, as pollen counts tend to be lower at that time.

Understanding the types of pollen and their seasonal variations in Lewisville can help residents and visitors alike prepare for and manage their pollen allergies. It's part of living in this vibrant city and a small price to pay for the beauty of its natural environment.

Lewisville, TX Map

What is Wyndly?

Wyndly is the easiest and most convenient way to fix your allergies forever. As an online allergy practice, Wyndly offers at-home allergy testing and treatment. The main goal of Wyndly is to retrain the immune system to stop responding to allergens, providing lasting relief from allergies.

Here's how Wyndly works:

  1. Identify Allergy Triggers: The first step is to identify the allergy triggers. You can purchase an at-home allergy test from Wyndly, or if you have already done an allergy test elsewhere, you can share your existing test results. This allows the doctors at Wyndly to pinpoint which allergies need to be treated.
  2. Get Treated by a Real Doctor: Using medications that are similar to those used in allergy shots, a doctor creates a unique sublingual immunotherapy treatment plan to desensitize your immune system. This is done using FDA-approved sublingual tablets or clinically proven dosing for oral use.
  3. Live Better Without Symptoms: The prescriptions are shipped to your door, and the doctor works with you until you’re better. Wyndly offers regular online check-ins with US-licensed physicians and 24/7 availability for questions or concerns via text, email, or call.

The treatment plans are personalized based on your specific allergy triggers and aim to treat allergies at their source, rather than just relieving symptoms for a short period. Most people report improvement in as little as one month.

Start with Wyndly today

Wyndly Summer 2023 Pollen Report Methodology

For each city, Wyndly obtained monthly pollen PPMs (pollen grains per cubic meter) for each form (tree, grass, and weed) from February 2022 - May 2023. Data were obtained from Pollen Sense, LLC Automated Particulate Sensors (APS). These sensors automatically detect particulate matter collected from ambient air, and use a neural network algorithm to identify individual pollen species and calculate daily pollen counts.

Yearly averages are calculated by summing the three allergen averages per month of data for a total monthly PPM, summing all monthly total PPMs, then dividing by 12 (month count). Used for per-city average, state average, and total USA average. Season comparisons are done by summing the months of Spring (March, April, May) for 2023 and 2022. If the absolute of the (2023-2022)/2022 is ≤ 0.05, the years were about the same. Otherwise, the more PPM, the worse the season was.

Is Wyndly right for you?

Answer just a few questions and we'll help you find out.

Get Started Today

Pollen and Allergy Reports by City