Palmdale, CA Pollen and Allergy Report for Summer 2023

Pollen Allergy Trends in Palmdale, CA
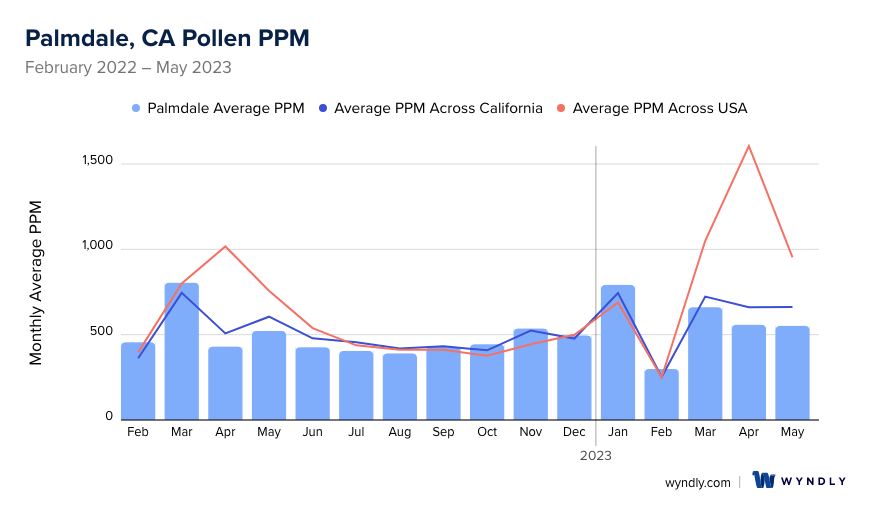
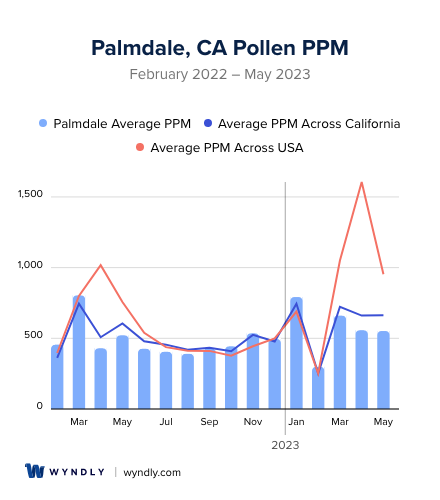
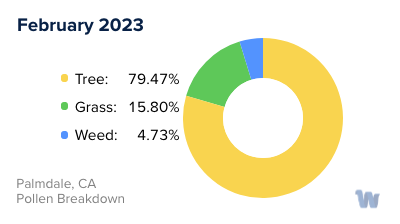
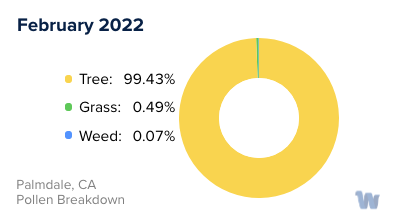
When is pollen lowest in Palmdale, CA?
February
Lowest month total PPM
Avg. PPM
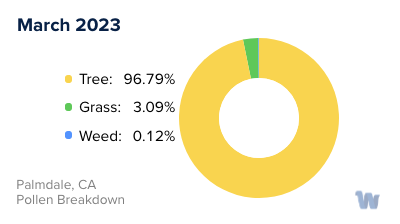
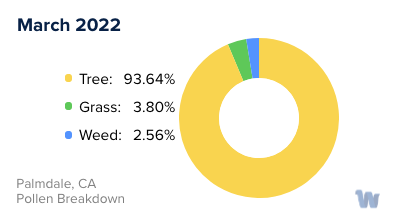
When is pollen highest in Palmdale, CA?
March
Highest month total PPM
Avg. PPM
How does pollen in Palmdale, CA compare to California?
Palmdale has a lower average PPM than the state of California.
Palmdale yearly avg PPM:
California yearly avg PPM:
How does pollen in Palmdale, CA compare to the USA?
Palmdale has a lower average PPM than the USA.
Palmdale yearly avg PPM:
USA yearly avg PPM:
Is pollen worse this year in Palmdale, CA?
Spring 2023 was about the same as 2022.
Spring 2023 PPM:
Spring 2022 PPM:
Average PPM in Palmdale, CA
Palmdale, CA Pollen and Allergy Breakdown by Month
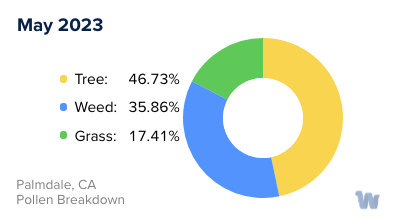
Grass
When is grass pollen highest in Palmdale, CA?
May has the highest grass pollen in Palmdale, CA with an average PPM of
When is grass pollen lowest in Palmdale, CA?
December has the lowest grass pollen in Palmdale, CA with an average PPM of
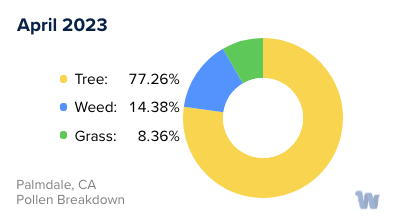
Tree
When is tree pollen highest in Palmdale, CA?
March has the highest tree pollen in Palmdale, CA with an average PPM of
When is tree pollen lowest in Palmdale, CA?
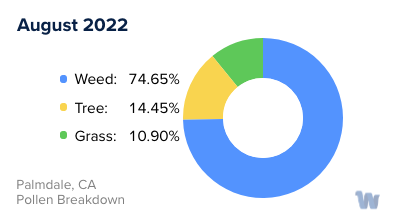
August has the lowest tree pollen in Palmdale, CA with an average PPM of
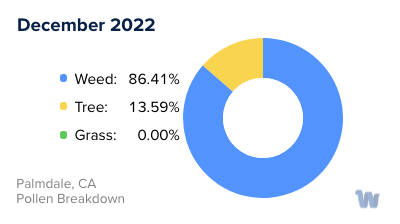
Weed
When is weed pollen highest in Palmdale, CA?
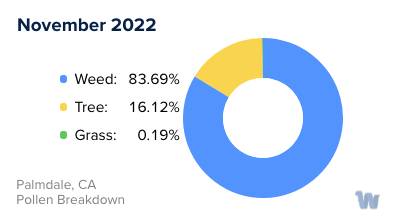
November has the highest weed pollen in Palmdale, CA with an average PPM of
When is weed pollen lowest in Palmdale, CA?
February has the lowest weed pollen in Palmdale, CA with an average PPM of
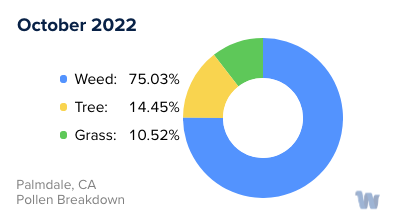
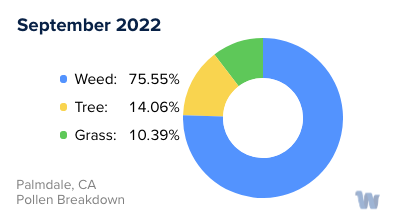
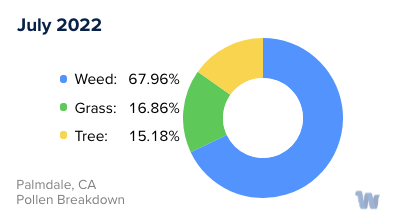
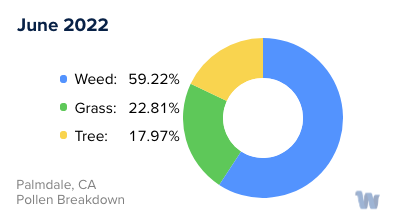
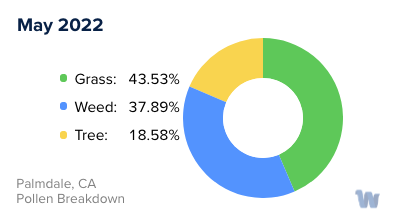
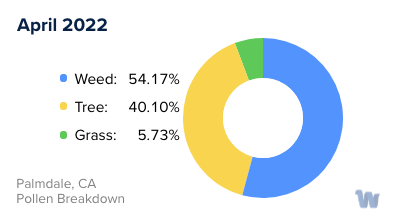
Palmdale, CA Pollen Monthly Breakdown by Pollen Type
Pollen and Hay Fever in Palmdale, CA
Pollen allergies, also known as hay fever, are a common cause of seasonal discomfort for many residents of Palmdale, California. Located in the Antelope Valley region, Palmdale's unique geographical setting contributes to a distinctive pollen profile.
The city's pollen season typically begins in the spring, often in late February or early March, and lasts until late fall. During this time, the city's vast array of native plant species release pollen into the air, affecting individuals with hay fever. The types of pollen that trigger allergies vary widely, but in Palmdale, three types are particularly prominent: grass, weed, and tree pollen.
Grass pollen, especially from Bermuda grass, ryegrass, and Kentucky bluegrass, which are commonly found in local lawns and parks, often peaks in late spring and early summer. While less common, some individuals also react to the pollen of desert-adapted grass species native to the surrounding areas.
Weed pollen, on the other hand, peaks in late summer and fall. Ragweed is a common trigger of weed pollen allergies and, while not native to California, it is present in Palmdale. Other significant sources of weed pollen include sagebrush, lamb's quarters, and Russian thistle.
Tree pollen is typically the first to appear in the year, often noticeable as early as February. Oak, cedar, and pine are common tree species in Palmdale, and they contribute significantly to the tree pollen counts. The high desert environment also supports a variety of native juniper and pinyon pine trees, both of which can produce allergenic pollen.
Living in Palmdale means experiencing the beauty of its diverse flora throughout the year. However, for those susceptible, it also means navigating the challenges of pollen allergies. Understanding the types of pollen and their respective seasons can help residents anticipate and manage their symptoms, leading to a more comfortable and enjoyable life in this beautiful desert city.