Lancaster, CA Pollen and Allergy Report for Summer 2023

Pollen Allergy Trends in Lancaster, CA
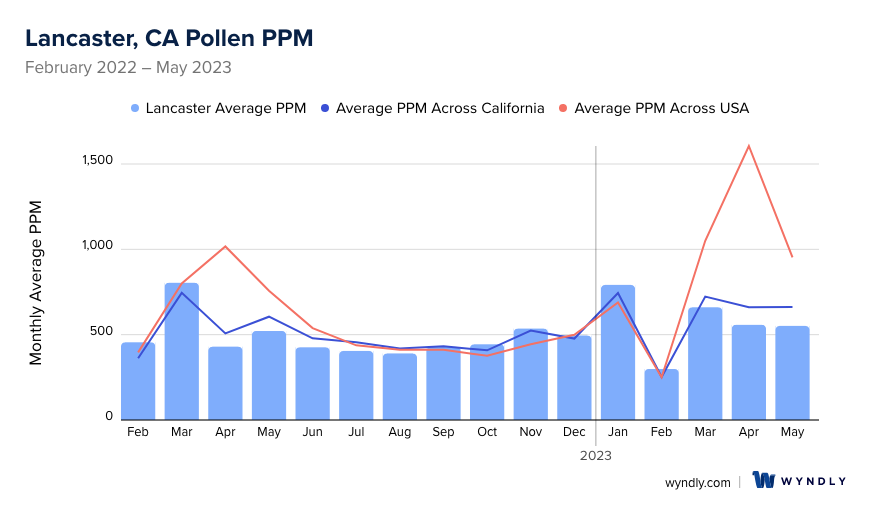
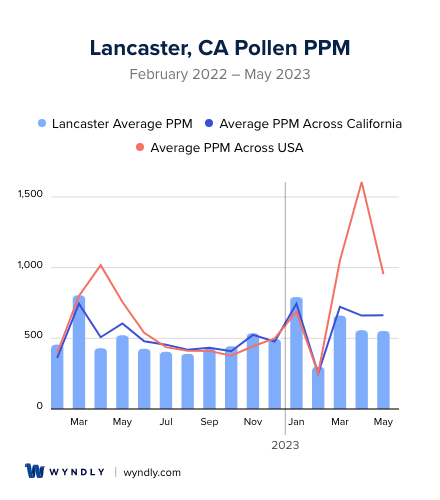
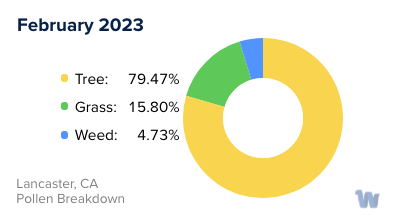
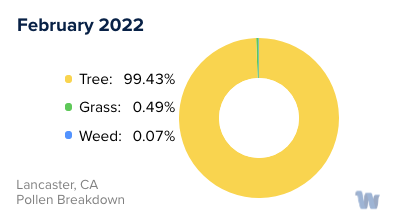
When is pollen lowest in Lancaster, CA?
February
Lowest month total PPM
Avg. PPM
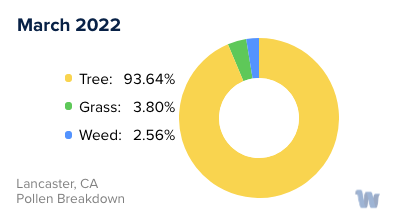
When is pollen highest in Lancaster, CA?
March
Highest month total PPM
Avg. PPM
How does pollen in Lancaster, CA compare to California?
Lancaster has a lower average PPM than the state of California.
Lancaster yearly avg PPM:
California yearly avg PPM:
How does pollen in Lancaster, CA compare to the USA?
Lancaster has a lower average PPM than the USA.
Lancaster yearly avg PPM:
USA yearly avg PPM:
Is pollen worse this year in Lancaster, CA?
Spring 2023 was about the same as 2022.
Spring 2023 PPM:
Spring 2022 PPM:
Average PPM in Lancaster, CA
Lancaster, CA Pollen and Allergy Breakdown by Month
Grass
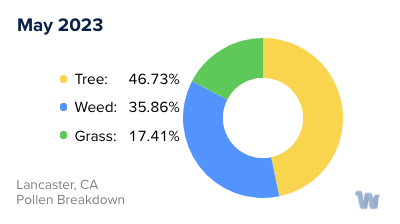
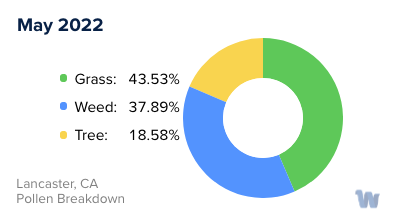
When is grass pollen highest in Lancaster, CA?
May has the highest grass pollen in Lancaster, CA with an average PPM of
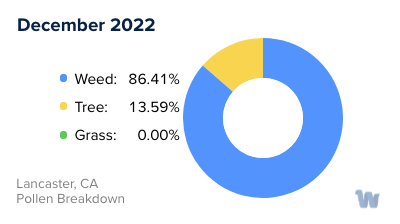
When is grass pollen lowest in Lancaster, CA?
December has the lowest grass pollen in Lancaster, CA with an average PPM of
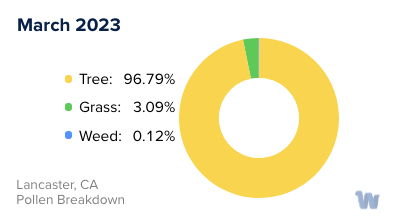
Tree
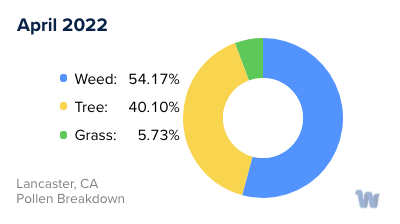
When is tree pollen highest in Lancaster, CA?
March has the highest tree pollen in Lancaster, CA with an average PPM of
When is tree pollen lowest in Lancaster, CA?
August has the lowest tree pollen in Lancaster, CA with an average PPM of
Weed
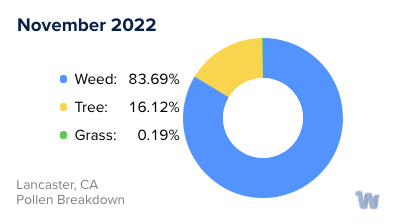
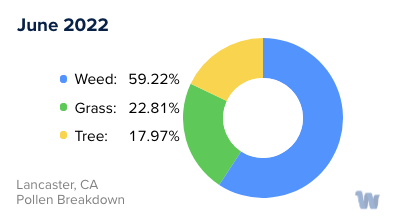
When is weed pollen highest in Lancaster, CA?
November has the highest weed pollen in Lancaster, CA with an average PPM of
When is weed pollen lowest in Lancaster, CA?
February has the lowest weed pollen in Lancaster, CA with an average PPM of
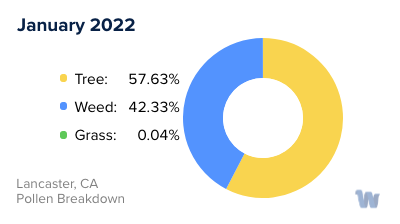
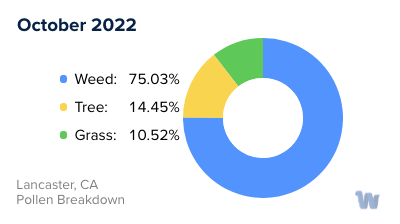
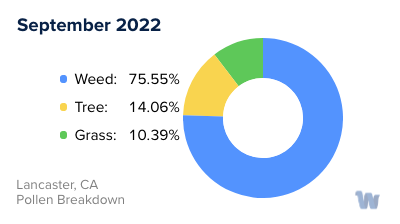
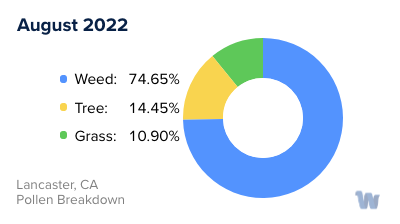
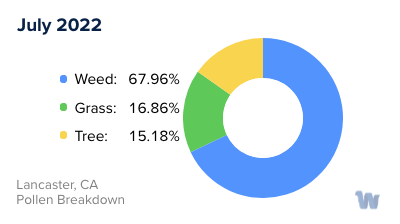
Lancaster, CA Pollen Monthly Breakdown by Pollen Type

Pollen and Hay Fever in Lancaster, CA
Ah, the beautiful city of Lancaster, California. Known for its stunning desert landscapes and year-round sunshine, it's a haven for outdoor enthusiasts. However, for many residents and visitors, this idyllic setting comes with a hidden challenge: pollen allergies, often referred to as hay fever.
The most common types of pollen that cause allergies in Lancaster are tree, grass, and weed pollen. Each type has a different blooming season, which could potentially mean year-round discomfort for those sensitive to all three types.
Tree pollen typically emerges in the spring. Certain tree species native to Lancaster, such as the California Juniper and Oak trees, are notorious for their high pollen production. Those who are sensitive to tree pollen might find themselves experiencing an onset of allergy symptoms starting around February and lasting until May.
Grass pollen is more prevalent in late spring and early summer. The culprits are usually Bermuda grass and Timothy grass, both commonly found in Lancaster. These grasses release their pollen into the air, especially during warm, dry, and windy days.
Weed pollen, from plants like ragweed and sagebrush, generally becomes an issue in late summer and fall. Sagebrush, a common plant in the desert climate of Lancaster, is particularly notorious for its allergy-inducing pollen.
The city's desert climate, with its dry and windy conditions, can exacerbate pollen dispersion, leading to a higher concentration of these airborne allergens. This can make certain times of the year particularly challenging for those with pollen sensitivities.
While pollen allergies can be a nuisance, understanding the types of pollen and their seasons can help you anticipate and manage symptoms better. Remember, it's not the beautiful landscapes of Lancaster that are the problem, it's the pollen they produce. So, enjoy the outdoors and stay informed about the pollen seasons in Lancaster.