Ann Arbor, MI Pollen and Allergy Report for Summer 2023

Pollen Allergy Trends in Ann Arbor, MI

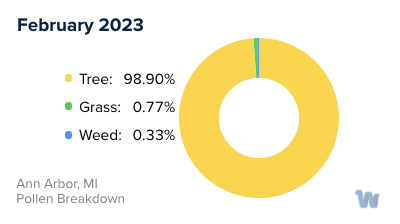
When is pollen lowest in Ann Arbor, MI?
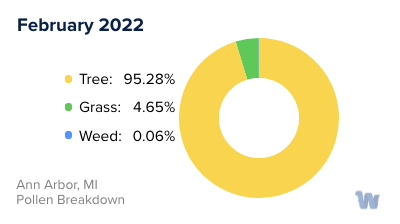
Green down arrow

February

Lowest month total PPM

113.45 Avg. PPM

When is pollen highest in Ann Arbor, MI?
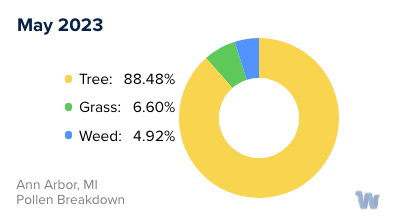
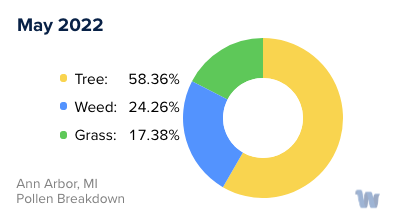
Red up arrow

May

Highest month total PPM

2,087.64 Avg. PPM

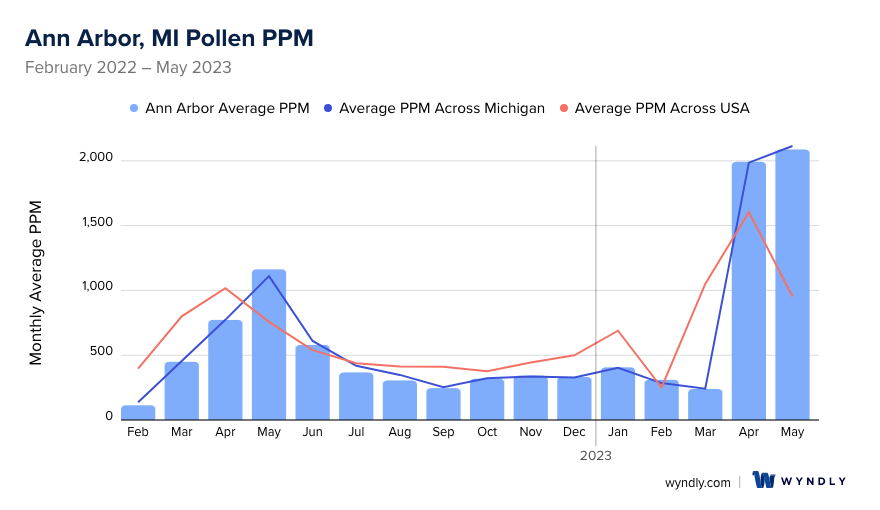
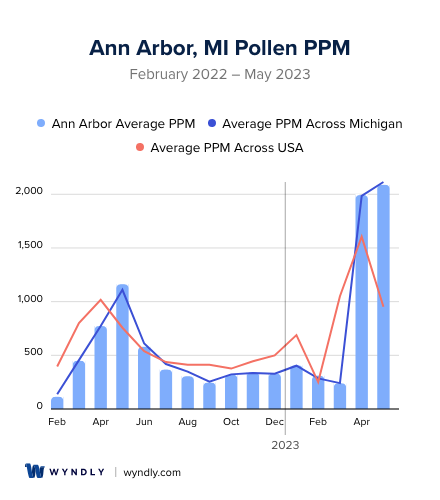
How does pollen in Ann Arbor, MI compare to Michigan?

Ann Arbor has a lower average PPM than the state of Michigan.

Ann Arbor yearly avg PPM: 626.51

Michigan yearly avg PPM: 632.6

How does pollen in Ann Arbor, MI compare to the USA?

Ann Arbor has a lower average PPM than the USA.

Ann Arbor yearly avg PPM: 626.51

USA yearly avg PPM: 664.86

Is pollen worse this year in Ann Arbor, MI?

Spring 2023 was worse than spring 2022.

Spring 2023 PPM: 4,319.8

Spring 2022 PPM: 2,383.77

Average PPM in Ann Arbor, MI

Ann Arbor, MI Average PPM Ann Arbor, MI Average PPM

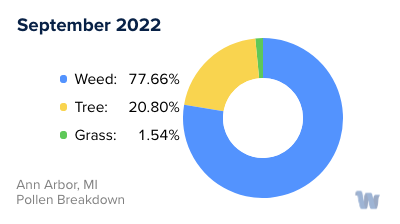
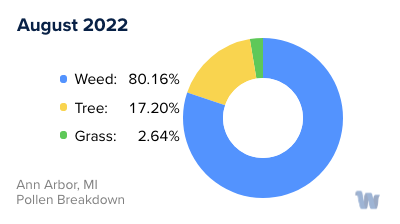
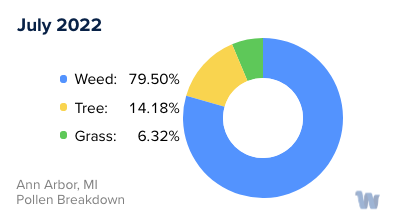
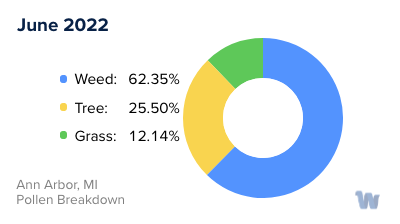
Ann Arbor, MI Pollen and Allergy Breakdown by Month

Grass

When is grass pollen highest in Ann Arbor, MI?

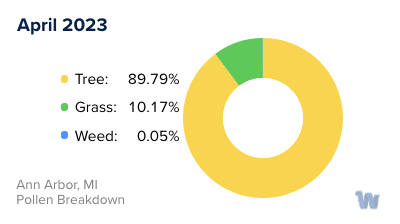
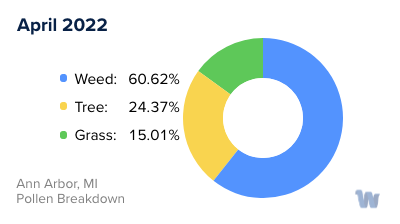
April has the highest grass pollen in Ann Arbor, MI with an average PPM of 202.53

When is grass pollen lowest in Ann Arbor, MI?

November has the lowest grass pollen in Ann Arbor, MI with an average PPM of
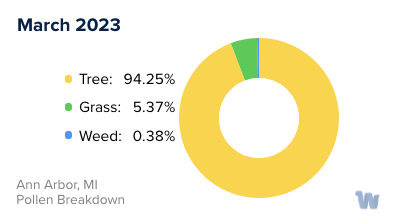
 0

Tree

When is tree pollen highest in Ann Arbor, MI?

May has the highest tree pollen in Ann Arbor, MI with an average PPM of 1,847.08

When is tree pollen lowest in Ann Arbor, MI?

September has the lowest tree pollen in Ann Arbor, MI with an average PPM of
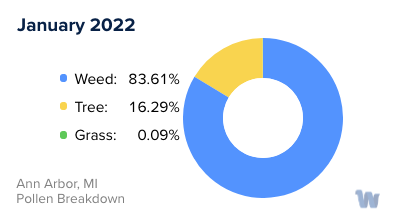
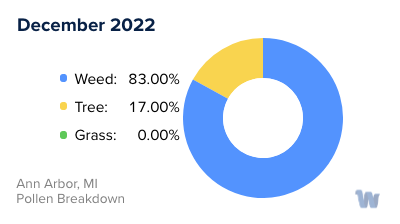
 51.14

Weed

When is weed pollen highest in Ann Arbor, MI?

April has the highest weed pollen in Ann Arbor, MI with an average PPM of 468.19

When is weed pollen lowest in Ann Arbor, MI?

February has the lowest weed pollen in Ann Arbor, MI with an average PPM of 0.07

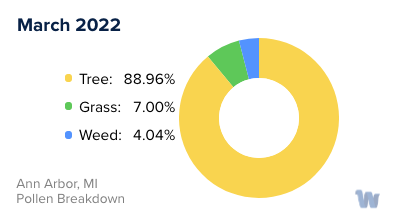
Ann Arbor, MI Pollen Monthly Breakdown by Pollen Type

Ann Arbor, MI Monthly Pollen Breakdown

Pollen and Hay Fever in Ann Arbor, MI

Pollen allergies, commonly known as hay fever, are a perennial concern for many in Ann Arbor, Michigan. The city's beautiful, lush vegetation, while a sight for sore eyes, may not be as pleasing for those who suffer from these allergies.

The types of pollen that commonly trigger allergies in Ann Arbor include tree pollen, grass pollen, and ragweed pollen.

Ann Arbor, MI Map

What is Wyndly?

Wyndly is the easiest and most convenient way to fix your allergies forever. As an online allergy practice, Wyndly offers at-home allergy testing and treatment. The main goal of Wyndly is to retrain the immune system to stop responding to allergens, providing lasting relief from allergies.

Here's how Wyndly works:

  1. Identify Allergy Triggers: The first step is to identify the allergy triggers. You can purchase an at-home allergy test from Wyndly, or if you have already done an allergy test elsewhere, you can share your existing test results. This allows the doctors at Wyndly to pinpoint which allergies need to be treated.
  2. Get Treated by a Real Doctor: Using medications that are similar to those used in allergy shots, a doctor creates a unique sublingual immunotherapy treatment plan to desensitize your immune system. This is done using FDA-approved sublingual tablets or clinically proven dosing for oral use.
  3. Live Better Without Symptoms: The prescriptions are shipped to your door, and the doctor works with you until you’re better. Wyndly offers regular online check-ins with US-licensed physicians and 24/7 availability for questions or concerns via text, email, or call.

The treatment plans are personalized based on your specific allergy triggers and aim to treat allergies at their source, rather than just relieving symptoms for a short period. Most people report improvement in as little as one month.

Start with Wyndly today

Wyndly Summer 2023 Pollen Report Methodology

For each city, Wyndly obtained monthly pollen PPMs (pollen grains per cubic meter) for each form (tree, grass, and weed) from February 2022 - May 2023. Data were obtained from Pollen Sense, LLC Automated Particulate Sensors (APS). These sensors automatically detect particulate matter collected from ambient air, and use a neural network algorithm to identify individual pollen species and calculate daily pollen counts.

Yearly averages are calculated by summing the three allergen averages per month of data for a total monthly PPM, summing all monthly total PPMs, then dividing by 12 (month count). Used for per-city average, state average, and total USA average. Season comparisons are done by summing the months of Spring (March, April, May) for 2023 and 2022. If the absolute of the (2023-2022)/2022 is ≤ 0.05, the years were about the same. Otherwise, the more PPM, the worse the season was.

Is Wyndly right for you?

Answer just a few questions and we'll help you find out.

Get Started Today

Pollen and Allergy Reports by City