Kansas City, MO Pollen and Allergy Report for Summer 2023

Pollen Allergy Trends in Kansas City, MO

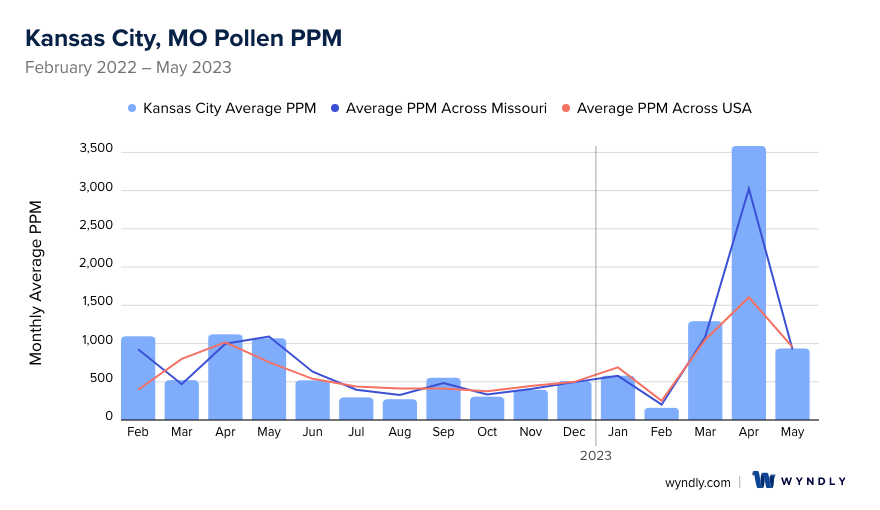
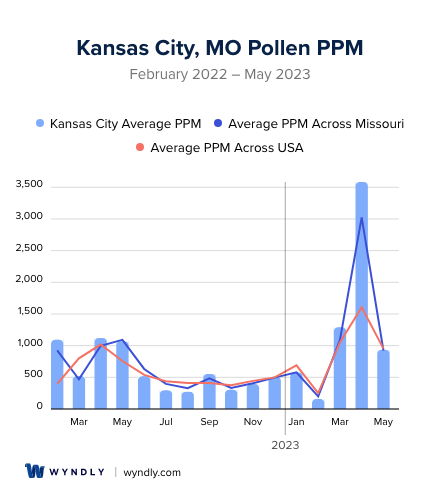
When is pollen lowest in Kansas City, MO?

Green down arrow

February

Lowest month total PPM

159.14 Avg. PPM

When is pollen highest in Kansas City, MO?
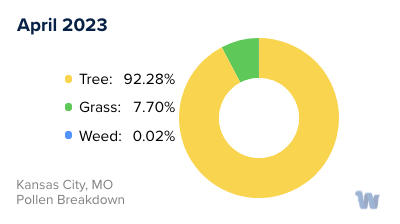
Red up arrow

April

Highest month total PPM

3,583.52 Avg. PPM

How does pollen in Kansas City, MO compare to Missouri?

Kansas City has a higher average PPM than the state of Missouri.

Kansas City yearly avg PPM: 825.2

Missouri yearly avg PPM: 773.23

How does pollen in Kansas City, MO compare to the USA?

Kansas City has a higher average PPM than the USA.

Kansas City yearly avg PPM: 825.2

USA yearly avg PPM: 664.86

Is pollen worse this year in Kansas City, MO?

Spring 2023 was worse than spring 2022.

Spring 2023 PPM: 5,811.37

Spring 2022 PPM: 2,710.4

Average PPM in Kansas City, MO

Kansas City, MO Average PPM Kansas City, MO Average PPM

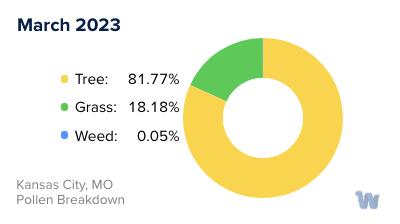
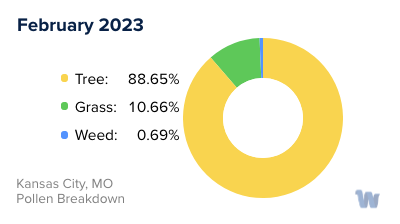
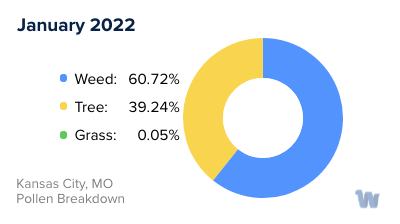
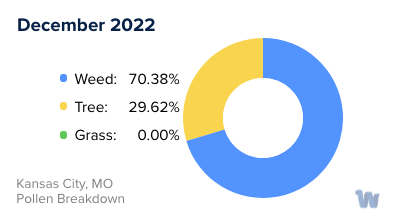
Kansas City, MO Pollen and Allergy Breakdown by Month
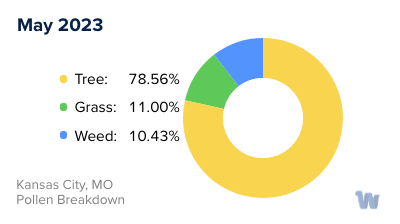
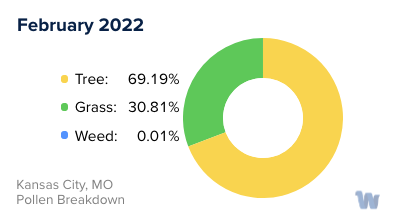
Grass

When is grass pollen highest in Kansas City, MO?

February has the highest grass pollen in Kansas City, MO with an average PPM of 337.25

When is grass pollen lowest in Kansas City, MO?

November has the lowest grass pollen in Kansas City, MO with an average PPM of
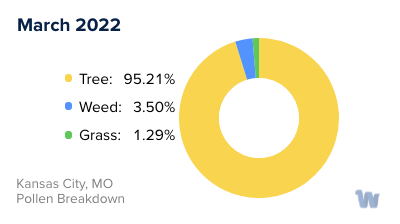
 0

Tree

When is tree pollen highest in Kansas City, MO?

April has the highest tree pollen in Kansas City, MO with an average PPM of 3,306.82

When is tree pollen lowest in Kansas City, MO?

October has the lowest tree pollen in Kansas City, MO with an average PPM of 53

Weed

When is weed pollen highest in Kansas City, MO?

April has the highest weed pollen in Kansas City, MO with an average PPM of 471.14

When is weed pollen lowest in Kansas City, MO?

February has the lowest weed pollen in Kansas City, MO with an average PPM of 0.07

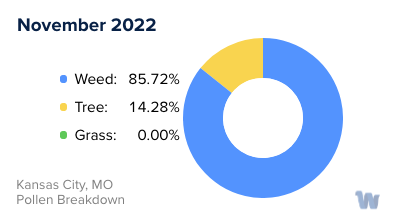
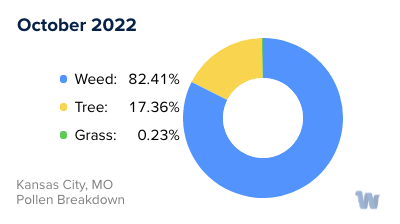
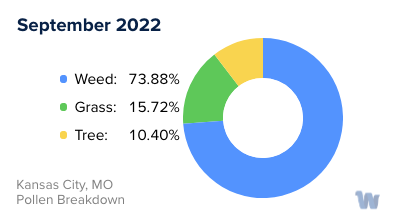
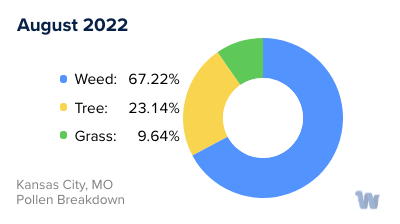
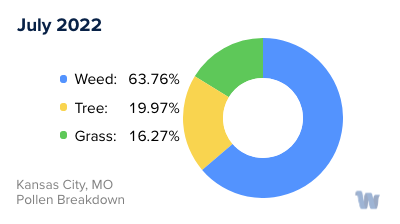
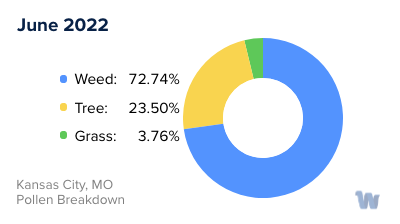
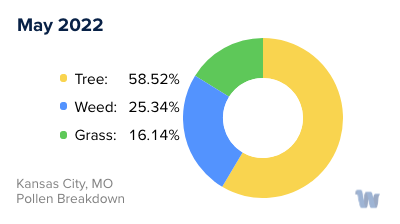
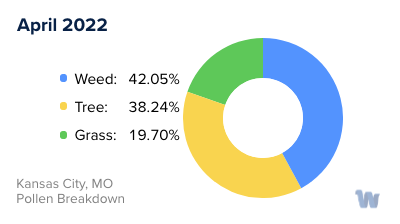
Kansas City, MO Pollen Monthly Breakdown by Pollen Type

Kansas City, MO Monthly Pollen Breakdown

Pollen and Hay Fever in Kansas City, MO

Pollen allergies, often referred to as hay fever or allergic rhinitis, are a common concern for residents of Kansas City, Missouri. These allergies are triggered by tiny grains released into the air by trees, grasses, and weeds for the purpose of fertilization. Each type of pollen has a peak period of release which often corresponds to a specific season.

Kansas City's diverse vegetation contributes to a variety of pollen types. In the spring, the main culprits are tree pollens. The city's abundant oak, maple, and cedar trees begin to release their pollen, turning the air into a veritable allergenic cocktail. This can lead to sneezing, a runny nose, itchy eyes, and other common hay fever symptoms.

As the seasons change, so too does the type of pollen in the air. Grass pollen starts to rise in late spring and continues throughout the early summer. Grasses like Kentucky bluegrass, Timothy grass, and ryegrass are common throughout Kansas City and produce pollen that can be highly allergenic.

Late summer and fall bring another shift in the pollen landscape. This time, it's weed pollen that dominates, particularly ragweed. Ragweed pollen can travel long distances on the wind, and a single plant can produce up to a billion grains of pollen in a season, making it a significant trigger for hay fever symptoms.

Living in Kansas City, understanding the local pollen seasons can help residents better anticipate and manage their allergy symptoms. While the impact of pollen allergies varies from person to person, being aware of what's in the air and when can be the first step towards living comfortably with hay fever.

Kansas City, MO Map

What is Wyndly?

Wyndly is the easiest and most convenient way to fix your allergies forever. As an online allergy practice, Wyndly offers at-home allergy testing and treatment. The main goal of Wyndly is to retrain the immune system to stop responding to allergens, providing lasting relief from allergies.

Here's how Wyndly works:

  1. Identify Allergy Triggers: The first step is to identify the allergy triggers. You can purchase an at-home allergy test from Wyndly, or if you have already done an allergy test elsewhere, you can share your existing test results. This allows the doctors at Wyndly to pinpoint which allergies need to be treated.
  2. Get Treated by a Real Doctor: Using medications that are similar to those used in allergy shots, a doctor creates a unique sublingual immunotherapy treatment plan to desensitize your immune system. This is done using FDA-approved sublingual tablets or clinically proven dosing for oral use.
  3. Live Better Without Symptoms: The prescriptions are shipped to your door, and the doctor works with you until you’re better. Wyndly offers regular online check-ins with US-licensed physicians and 24/7 availability for questions or concerns via text, email, or call.

The treatment plans are personalized based on your specific allergy triggers and aim to treat allergies at their source, rather than just relieving symptoms for a short period. Most people report improvement in as little as one month.

Start with Wyndly today

Wyndly Summer 2023 Pollen Report Methodology

For each city, Wyndly obtained monthly pollen PPMs (pollen grains per cubic meter) for each form (tree, grass, and weed) from February 2022 - May 2023. Data were obtained from Pollen Sense, LLC Automated Particulate Sensors (APS). These sensors automatically detect particulate matter collected from ambient air, and use a neural network algorithm to identify individual pollen species and calculate daily pollen counts.

Yearly averages are calculated by summing the three allergen averages per month of data for a total monthly PPM, summing all monthly total PPMs, then dividing by 12 (month count). Used for per-city average, state average, and total USA average. Season comparisons are done by summing the months of Spring (March, April, May) for 2023 and 2022. If the absolute of the (2023-2022)/2022 is ≤ 0.05, the years were about the same. Otherwise, the more PPM, the worse the season was.

Is Wyndly right for you?

Answer just a few questions and we'll help you find out.

Get Started Today

Pollen and Allergy Reports by City