Killeen, TX Pollen and Allergy Report for Summer 2023

Pollen Allergy Trends in Killeen, TX
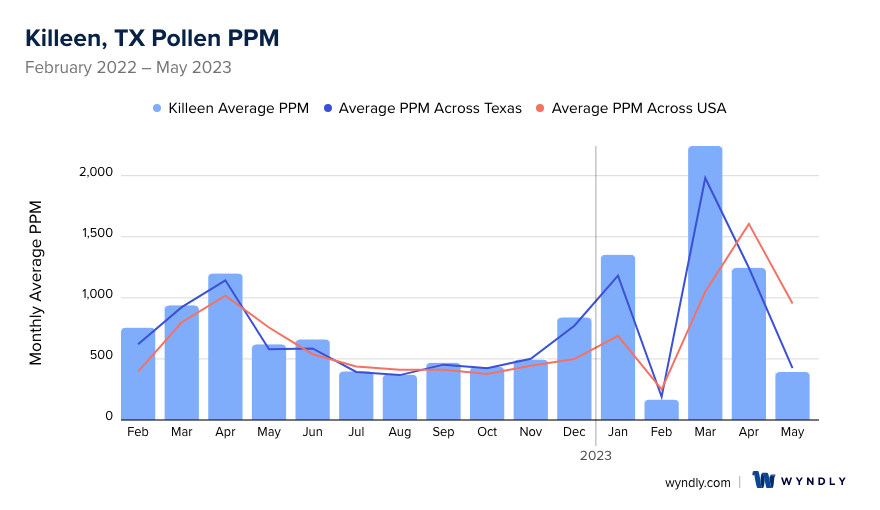
When is pollen lowest in Killeen, TX?
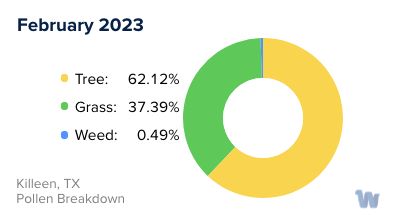
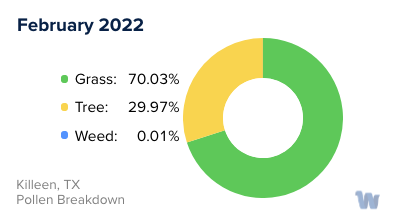
February
Lowest month total PPM
Avg. PPM
When is pollen highest in Killeen, TX?
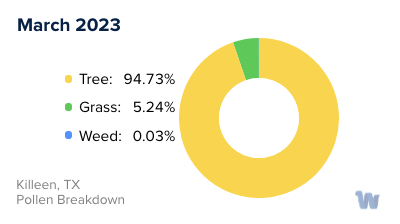
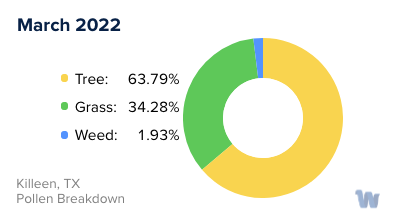
March
Highest month total PPM
Avg. PPM
How does pollen in Killeen, TX compare to Texas?
Killeen has a higher average PPM than the state of Texas.
Killeen yearly avg PPM:
Texas yearly avg PPM:
How does pollen in Killeen, TX compare to the USA?
Killeen has a higher average PPM than the USA.
Killeen yearly avg PPM:
USA yearly avg PPM:
Is pollen worse this year in Killeen, TX?
Spring 2023 was worse than spring 2022.
Spring 2023 PPM:
Spring 2022 PPM:
Average PPM in Killeen, TX
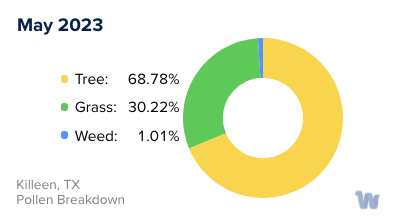
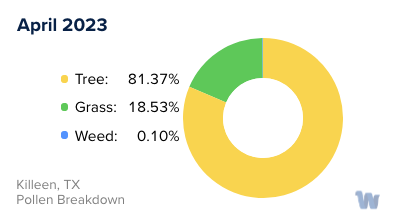
Killeen, TX Pollen and Allergy Breakdown by Month
Grass
When is grass pollen highest in Killeen, TX?
February has the highest grass pollen in Killeen, TX with an average PPM of
When is grass pollen lowest in Killeen, TX?
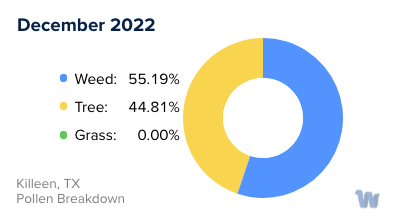
December has the lowest grass pollen in Killeen, TX with an average PPM of
Tree
When is tree pollen highest in Killeen, TX?
March has the highest tree pollen in Killeen, TX with an average PPM of
When is tree pollen lowest in Killeen, TX?
July has the lowest tree pollen in Killeen, TX with an average PPM of
Weed
When is weed pollen highest in Killeen, TX?
December has the highest weed pollen in Killeen, TX with an average PPM of
When is weed pollen lowest in Killeen, TX?
February has the lowest weed pollen in Killeen, TX with an average PPM of
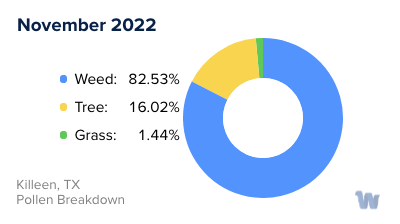
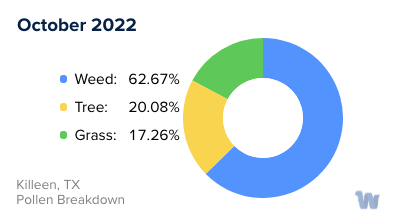
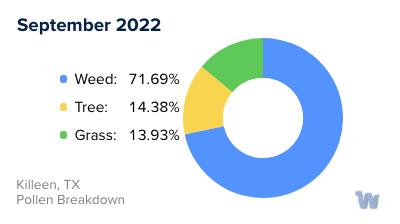
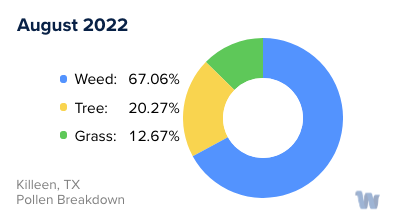
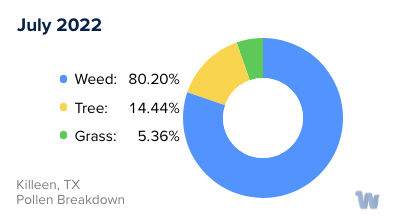
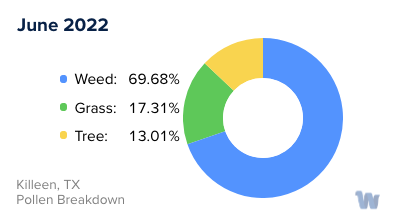
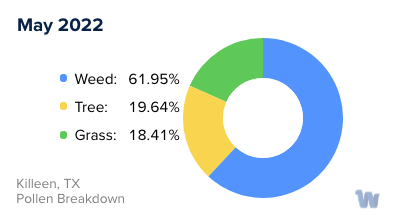
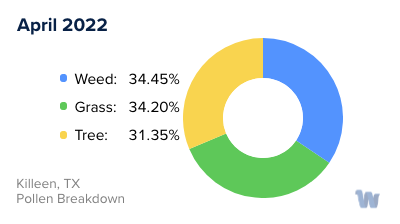
Killeen, TX Pollen Monthly Breakdown by Pollen Type
Pollen and Hay Fever in Killeen, TX
In the heart of Texas, the city of Killeen is no stranger to pollen allergies, often referred to as hay fever. This condition, characterized by symptoms such as congestion, runny nose, and watery eyes, is particularly triggered by the pollen from area cedar trees, known as mountain cedar, or Ashe juniper.
Pollen counts, measured on a scale from zero to 12, frequently reach high levels in Killeen. These counts can rise to 9.4 or even 11.7, especially when assisted by strong southwestern winds that blow the mountain cedar from the hill country. This airborne pollen significantly impacts a large number of people in the area.
Interestingly, weather patterns can cause fluctuations in pollen levels. Rain, for instance, can help drive the pollen numbers down, providing some respite from the high counts. However, Killeen residents have noted that recent cedar seasons seem to be intensifying, with the current season seeming worse than those of years past.
Cedar trees in Texas have a unique pollinating period that contributes to the prevalence of cedar fever. These trees typically begin producing pollen in mid-December, often triggered by colder weather or the passage of a cold front. Pollen production reaches its peak in mid-January before slowly tapering off toward the beginning of March. This timing is particularly challenging because, unlike most trees that pollinate in the spring, cedar trees release their pollen in winter, a time when few other plants are pollinating.
While cedar pollen is a major cause of hay fever in Killeen, it's important to note that other types of tree pollen can also contribute to allergy symptoms. However, based on the available information, cedar pollen appears to be the primary offender in Killeen.
It is important for those living in Killeen to understand these pollen trends and take necessary precautions during high pollen seasons. This knowledge can help individuals anticipate and manage their hay fever symptoms effectively.