Kansas City, KS Pollen and Allergy Report for Summer 2023

Pollen Allergy Trends in Kansas City, KS
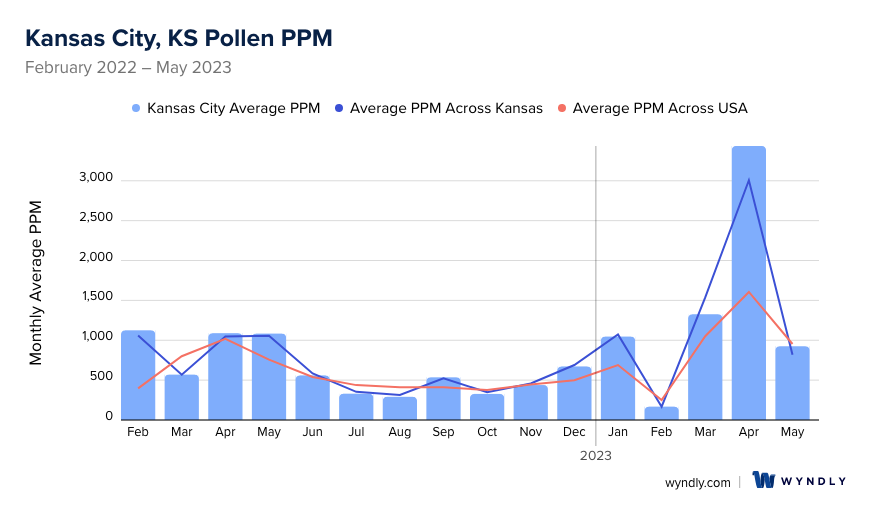
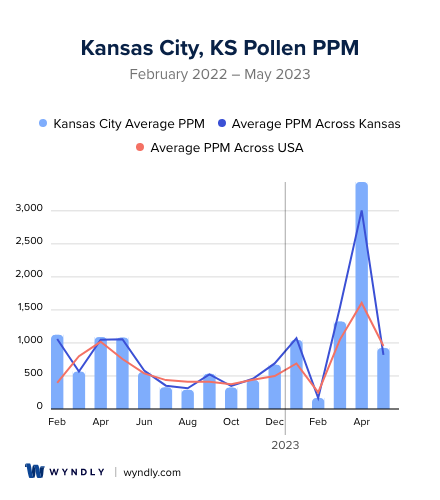
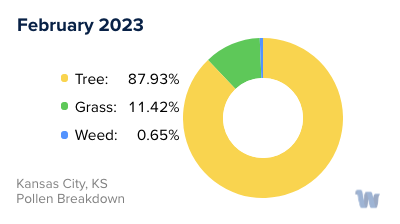
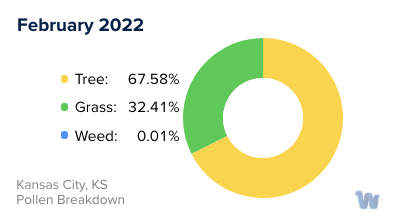
When is pollen lowest in Kansas City, KS?
February
Lowest month total PPM
Avg. PPM
When is pollen highest in Kansas City, KS?
April
Highest month total PPM
Avg. PPM
How does pollen in Kansas City, KS compare to Kansas?
Kansas City has a higher average PPM than the state of Kansas.
Kansas City yearly avg PPM:
Kansas yearly avg PPM:
How does pollen in Kansas City, KS compare to the USA?
Kansas City has a higher average PPM than the USA.
Kansas City yearly avg PPM:
USA yearly avg PPM:
Is pollen worse this year in Kansas City, KS?
Spring 2023 was worse than spring 2022.
Spring 2023 PPM:
Spring 2022 PPM:
Average PPM in Kansas City, KS
Kansas City, KS Pollen and Allergy Breakdown by Month
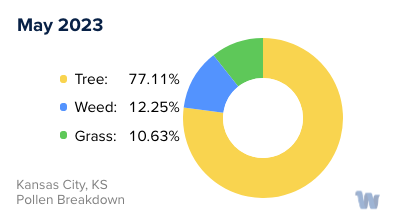
Grass
When is grass pollen highest in Kansas City, KS?
February has the highest grass pollen in Kansas City, KS with an average PPM of
When is grass pollen lowest in Kansas City, KS?
December has the lowest grass pollen in Kansas City, KS with an average PPM of
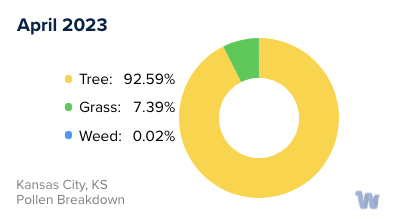
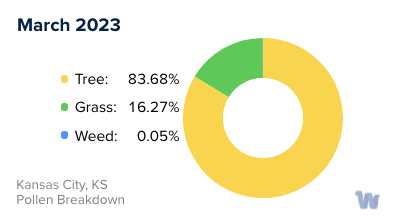
Tree
When is tree pollen highest in Kansas City, KS?
April has the highest tree pollen in Kansas City, KS with an average PPM of
When is tree pollen lowest in Kansas City, KS?
September has the lowest tree pollen in Kansas City, KS with an average PPM of
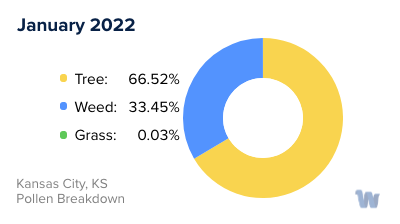
Weed
When is weed pollen highest in Kansas City, KS?
April has the highest weed pollen in Kansas City, KS with an average PPM of
When is weed pollen lowest in Kansas City, KS?
February has the lowest weed pollen in Kansas City, KS with an average PPM of
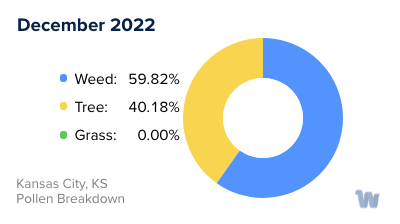
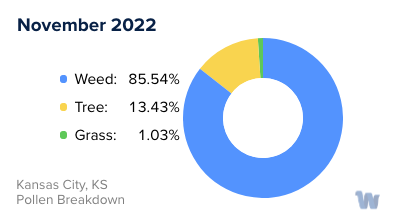
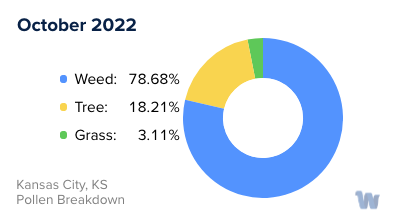
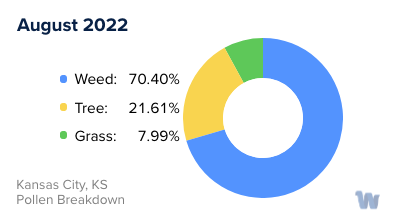
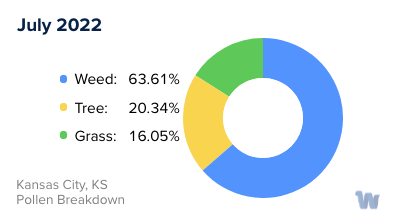
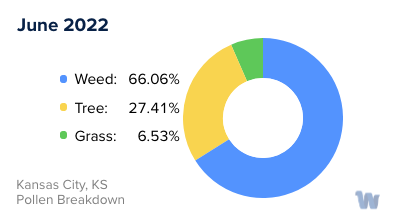
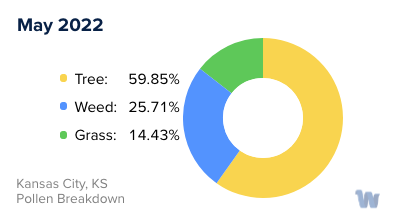
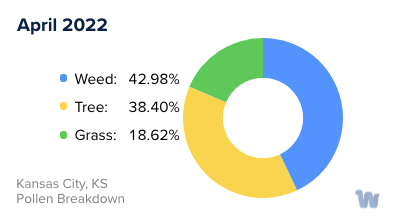
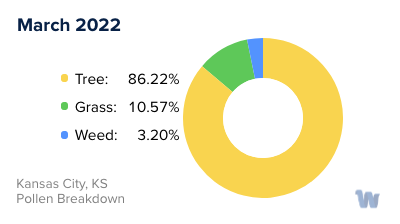
Kansas City, KS Pollen Monthly Breakdown by Pollen Type

Pollen and Hay Fever in Kansas City, KS
As we welcome the different seasons in Kansas City, Kansas, so too do we greet the variety of pollens that accompany them. Pollen allergies, commonly known as hay fever, are a significant concern for many of the city's residents, and understanding the types of pollen and their seasonal patterns is key to navigating this annual challenge.
Spring in Kansas City is a vibrant spectacle of blooming plants, but it's also the peak season for tree pollens. From oak and cedar to maple and pine, tree pollen is abundant in the air, posing an allergenic challenge to many.
As we transition into summer, the trees take a backseat, and grass pollen takes center stage. Common grasses like Timothy, Bermuda, and Kentucky bluegrass release their pollen, turning the warm, sunny days into a sneezing spectacle for those sensitive to these types. These grass pollens tend to peak in June and slowly decrease as the summer progresses.
Fall ushers in a different pollen protagonist: the weeds. Of these, ragweed is the most notorious. A single ragweed plant can produce up to one billion pollen grains in a season, making it a significant contributor to hay fever during this period.
Kansas City's winter is a time of respite for allergy sufferers as cold temperatures halt pollen production. However, it's worth noting that unusually warm winter days can spur some trees to release pollen early, leading to a surprise bout of hay fever.
The shifting kaleidoscope of pollen types and their seasonal patterns in Kansas City underscores the importance of understanding what triggers our allergies. Armed with this knowledge, residents can anticipate the challenges each season may bring and take steps to manage their symptoms without resorting to remedies or treatments. After all, being prepared is half the battle, and in the case of hay fever, forewarned is forearmed.