Clovis, CA Pollen and Allergy Report for Summer 2023

Pollen Allergy Trends in Clovis, CA

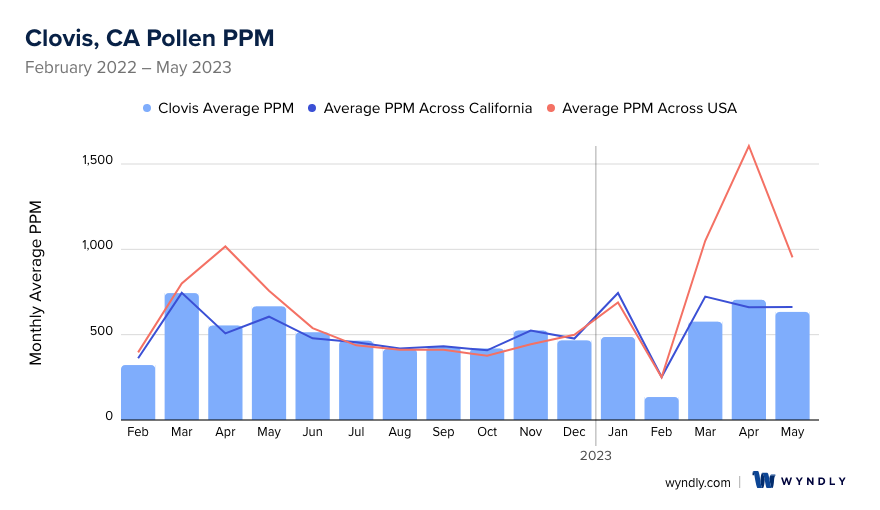
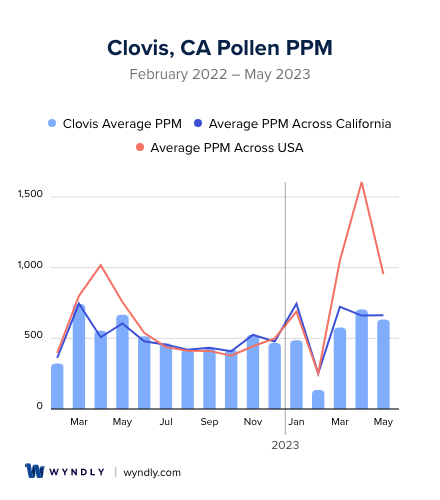
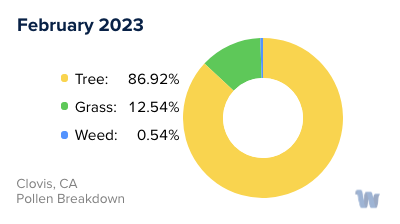
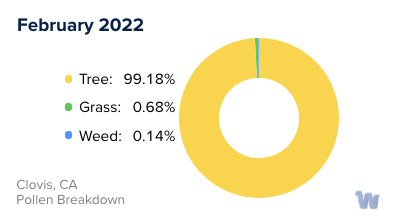
When is pollen lowest in Clovis, CA?

Green down arrow

February

Lowest month total PPM

134.53 Avg. PPM

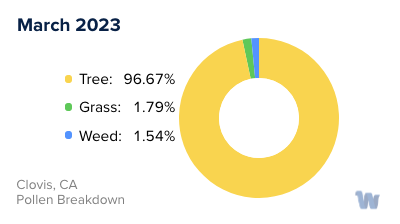
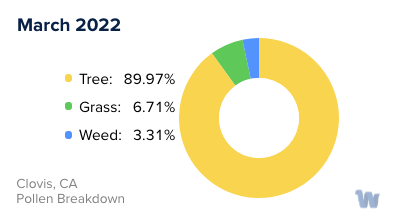
When is pollen highest in Clovis, CA?

Red up arrow

March

Highest month total PPM

743.53 Avg. PPM

How does pollen in Clovis, CA compare to California?

Clovis has a lower average PPM than the state of California.

Clovis yearly avg PPM: 503.5

California yearly avg PPM: 528.52

How does pollen in Clovis, CA compare to the USA?

Clovis has a lower average PPM than the USA.

Clovis yearly avg PPM: 503.5

USA yearly avg PPM: 664.86

Is pollen worse this year in Clovis, CA?

Spring 2023 was about the same as 2022.

Spring 2023 PPM: 1,914.4

Spring 2022 PPM: 1,963.94

Average PPM in Clovis, CA

Clovis, CA Average PPM Clovis, CA Average PPM

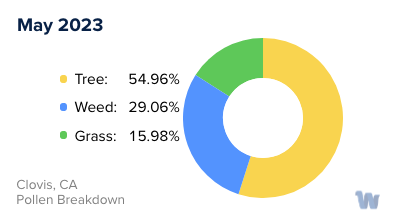
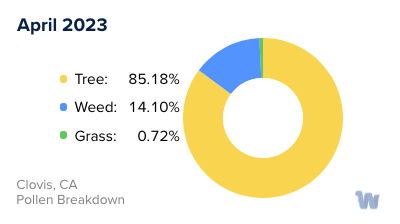
Clovis, CA Pollen and Allergy Breakdown by Month
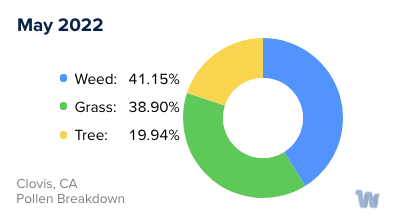
Grass

When is grass pollen highest in Clovis, CA?

May has the highest grass pollen in Clovis, CA with an average PPM of 259.19

When is grass pollen lowest in Clovis, CA?

December has the lowest grass pollen in Clovis, CA with an average PPM of
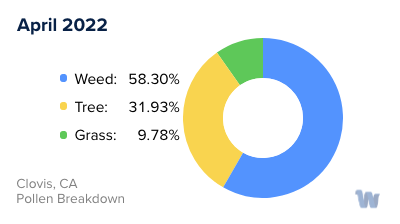
 0

Tree

When is tree pollen highest in Clovis, CA?

March has the highest tree pollen in Clovis, CA with an average PPM of 668.97

When is tree pollen lowest in Clovis, CA?

August has the lowest tree pollen in Clovis, CA with an average PPM of
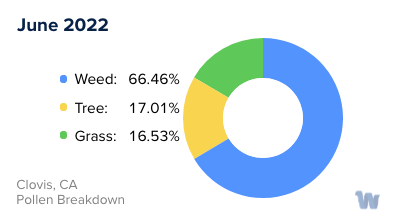
 56.38

Weed

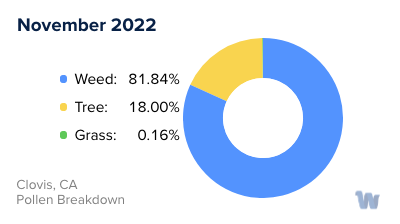
When is weed pollen highest in Clovis, CA?

November has the highest weed pollen in Clovis, CA with an average PPM of 429.53

When is weed pollen lowest in Clovis, CA?

February has the lowest weed pollen in Clovis, CA with an average PPM of 0.45

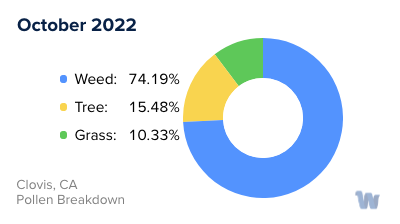
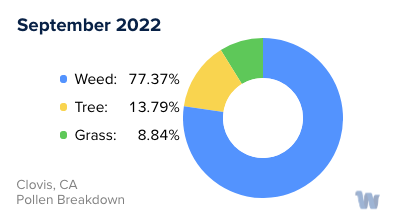
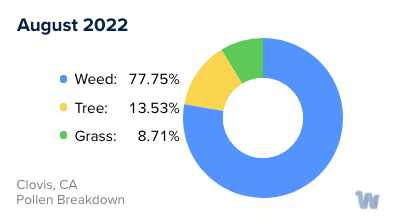
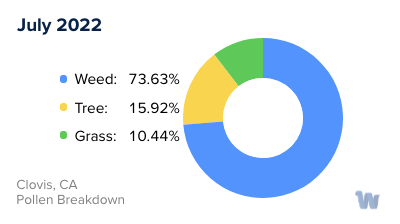
Clovis, CA Pollen Monthly Breakdown by Pollen Type

Clovis, CA Monthly Pollen Breakdown

Pollen and Hay Fever in Clovis, CA

n the charming city of Clovis, California, residents and visitors alike might experience the common symptoms of pollen allergies, also known as hay fever. This condition is primarily provoked by three types of pollen: trees, grass, and weeds. Each of these allergens has its own peak season, which can contribute to a nearly year-long allergy season in the Golden State.

Tree pollen is a significant cause of hay fever and is prevalent in Clovis. It often starts appearing in late January, marking the onset of the allergy season in California. As winter gradually transitions into spring, the pollen counts can surge, potentially exacerbating symptoms for those sensitive to tree pollen.

Grass pollen typically follows in the footsteps of tree pollen. The warmer months of spring and summer, especially April and May, are peak times for grass pollen. During these months, it's not uncommon for pollen counts to be high, potentially leading to an increase in hay fever symptoms among susceptible individuals.

Finally, weed pollen tends to be a concern later in the year. It can become particularly prevalent in the fall, with September noted as a peak month. It's worth mentioning that the unique climate of California allows for a relatively extended allergy season, often not tapering off until October or November.

It's crucial to remember that the timing and severity of pollen seasons can vary from year to year and are influenced by a variety of factors, including weather patterns and precipitation. Despite these challenges, understanding the primary pollen types and their seasonal trends in Clovis, California, can help individuals anticipate and manage their hay fever symptoms better, contributing to a higher quality of life in this beautiful city.

Clovis, CA Map

What is Wyndly?

Wyndly is the easiest and most convenient way to fix your allergies forever. As an online allergy practice, Wyndly offers at-home allergy testing and treatment. The main goal of Wyndly is to retrain the immune system to stop responding to allergens, providing lasting relief from allergies.

Here's how Wyndly works:

  1. Identify Allergy Triggers: The first step is to identify the allergy triggers. You can purchase an at-home allergy test from Wyndly, or if you have already done an allergy test elsewhere, you can share your existing test results. This allows the doctors at Wyndly to pinpoint which allergies need to be treated.
  2. Get Treated by a Real Doctor: Using medications that are similar to those used in allergy shots, a doctor creates a unique sublingual immunotherapy treatment plan to desensitize your immune system. This is done using FDA-approved sublingual tablets or clinically proven dosing for oral use.
  3. Live Better Without Symptoms: The prescriptions are shipped to your door, and the doctor works with you until you’re better. Wyndly offers regular online check-ins with US-licensed physicians and 24/7 availability for questions or concerns via text, email, or call.

The treatment plans are personalized based on your specific allergy triggers and aim to treat allergies at their source, rather than just relieving symptoms for a short period. Most people report improvement in as little as one month.

Start with Wyndly today

Wyndly Summer 2023 Pollen Report Methodology

For each city, Wyndly obtained monthly pollen PPMs (pollen grains per cubic meter) for each form (tree, grass, and weed) from February 2022 - May 2023. Data were obtained from Pollen Sense, LLC Automated Particulate Sensors (APS). These sensors automatically detect particulate matter collected from ambient air, and use a neural network algorithm to identify individual pollen species and calculate daily pollen counts.

Yearly averages are calculated by summing the three allergen averages per month of data for a total monthly PPM, summing all monthly total PPMs, then dividing by 12 (month count). Used for per-city average, state average, and total USA average. Season comparisons are done by summing the months of Spring (March, April, May) for 2023 and 2022. If the absolute of the (2023-2022)/2022 is ≤ 0.05, the years were about the same. Otherwise, the more PPM, the worse the season was.

Is Wyndly right for you?

Answer just a few questions and we'll help you find out.

Get Started Today

Pollen and Allergy Reports by City