Inglewood, CA Pollen and Allergy Report for Summer 2023

Pollen Allergy Trends in Inglewood, CA
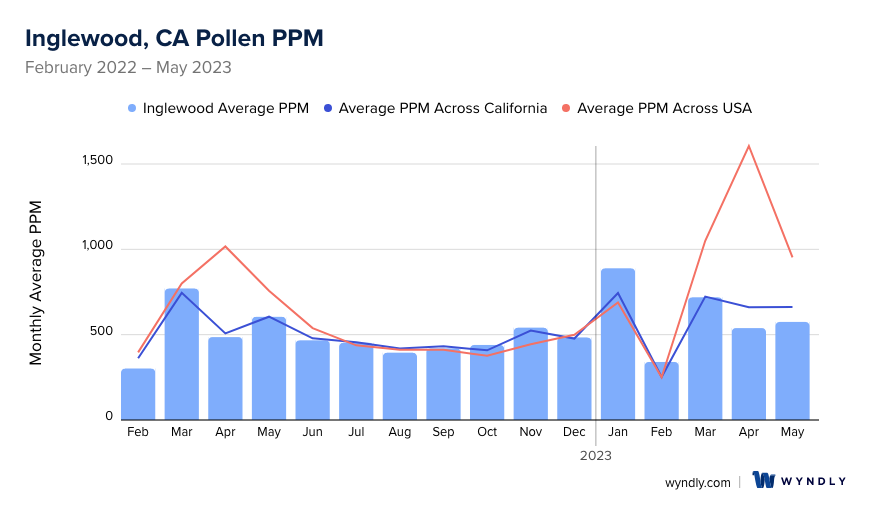
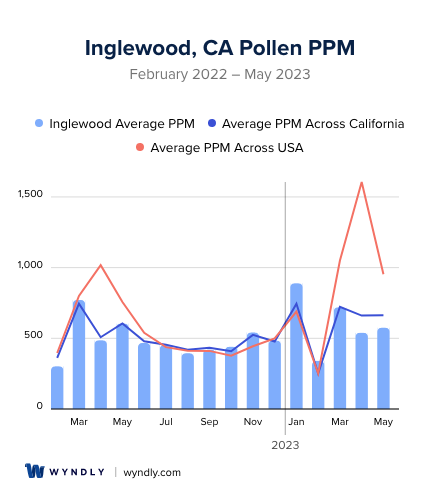
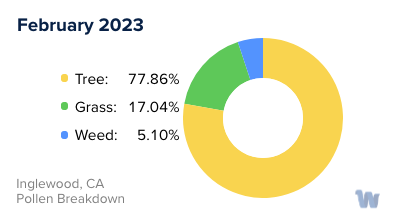
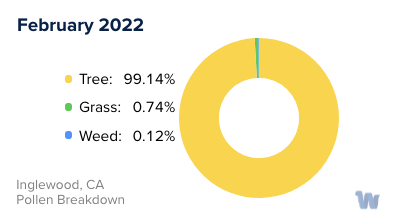
When is pollen lowest in Inglewood, CA?
February
Lowest month total PPM
Avg. PPM
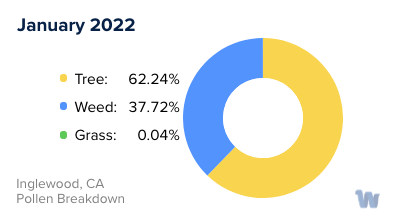
When is pollen highest in Inglewood, CA?
January
Highest month total PPM
Avg. PPM
How does pollen in Inglewood, CA compare to California?
Inglewood has a lower average PPM than the state of California.
Inglewood yearly avg PPM:
California yearly avg PPM:
How does pollen in Inglewood, CA compare to the USA?
Inglewood has a lower average PPM than the USA.
Inglewood yearly avg PPM:
USA yearly avg PPM:
Is pollen worse this year in Inglewood, CA?
Spring 2023 was about the same as 2022.
Spring 2023 PPM:
Spring 2022 PPM:
Average PPM in Inglewood, CA
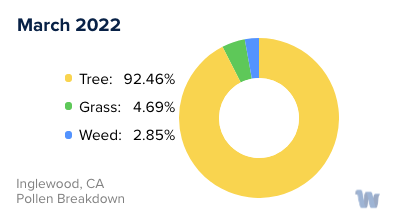
Inglewood, CA Pollen and Allergy Breakdown by Month
Grass
When is grass pollen highest in Inglewood, CA?
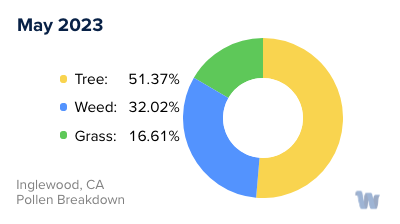
May has the highest grass pollen in Inglewood, CA with an average PPM of
When is grass pollen lowest in Inglewood, CA?
December has the lowest grass pollen in Inglewood, CA with an average PPM of
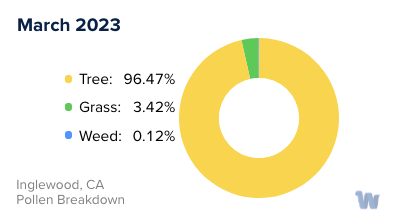
Tree
When is tree pollen highest in Inglewood, CA?
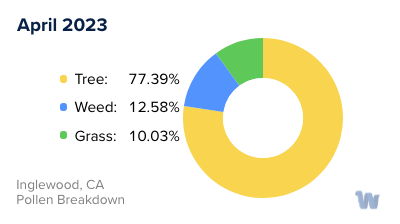
March has the highest tree pollen in Inglewood, CA with an average PPM of
When is tree pollen lowest in Inglewood, CA?
August has the lowest tree pollen in Inglewood, CA with an average PPM of
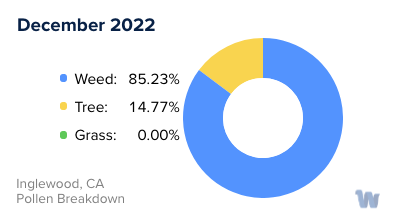
Weed
When is weed pollen highest in Inglewood, CA?
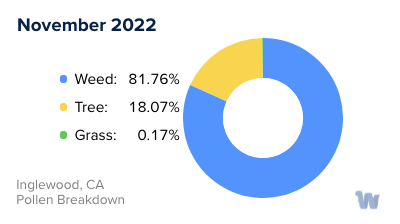
November has the highest weed pollen in Inglewood, CA with an average PPM of
When is weed pollen lowest in Inglewood, CA?
February has the lowest weed pollen in Inglewood, CA with an average PPM of
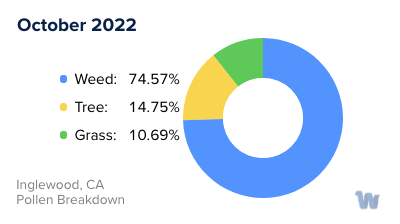
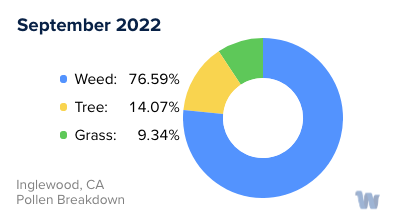
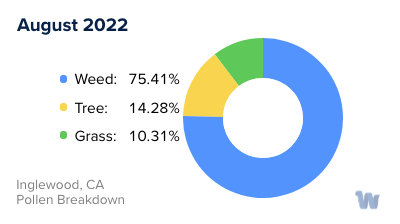
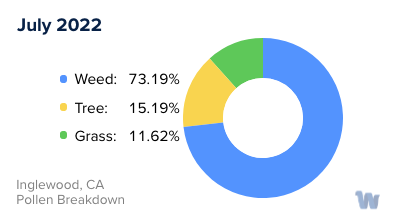
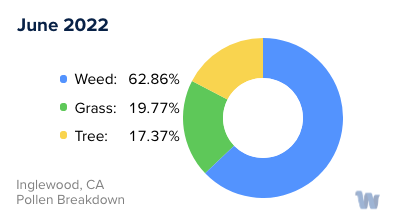
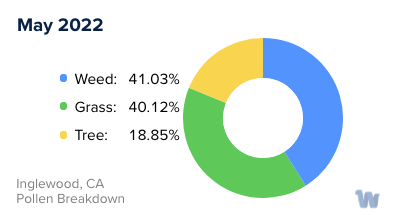
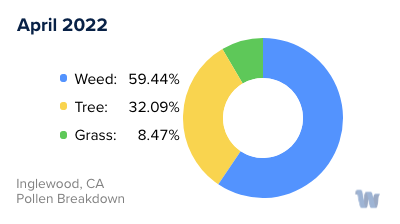
Inglewood, CA Pollen Monthly Breakdown by Pollen Type
Pollen and Hay Fever in Inglewood, CA
As summer dawns on Inglewood, California, the city blossoms with nature's beauty, but for some, it also ushers in an unwelcome guest: pollen allergies, commonly known as hay fever. Inglewood, like many other areas in Southern California, has a diverse flora that contributes to the seasonal ebb and flow of pollen counts, and consequently, the allergic responses of its residents.
In the spring, grasses such as Bermuda grass, Kentucky bluegrass, and ryegrass begin to release pollen, triggering hay fever symptoms in susceptible individuals. These grasses are common in lawns, sports fields, and parks across Inglewood, so residents may find that their symptoms peak during outdoor activities.
When the calendar turns to summer, the chief pollen producers switch from grasses to weeds. Ragweed, a prolific pollen producer, is the main culprit in this season. However, it's not just ragweed; other weed species like sagebrush and pigweed also contribute to the pollen count.
Pollen from trees can also cause hay fever, although this is less common in Inglewood compared to other regions due to the city's urban nature. However, the city does have its fair share of oak, pine, and cedar trees, and these species typically release their pollen in the late winter and early spring.
The timing and severity of pollen allergies can vary year-to-year, influenced by weather patterns and rainfall. Warmer, drier conditions can cause plants to produce more pollen, while rain can help wash pollen away, providing temporary relief. However, rain can also promote plant growth and lead to a surge in pollen production once the skies clear.
In sum, pollen allergies in Inglewood, California, are a seasonal phenomenon, with grasses, weeds, and occasionally trees playing a role in triggering symptoms. By understanding the types of pollen and the seasons in which they peak, residents can better anticipate and manage their allergic responses. Whether it's the grasses of spring, the weeds of summer, or the occasional tree pollen, hay fever is a part of life in Inglewood that serves as a reminder of our complex relationship with nature.