Hartford, CT Pollen and Allergy Report for Summer 2023

Pollen Allergy Trends in Hartford, CT
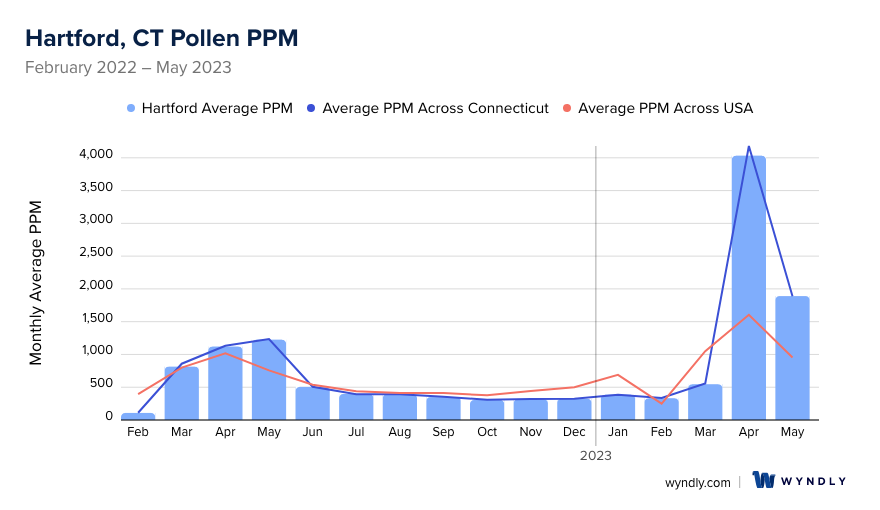
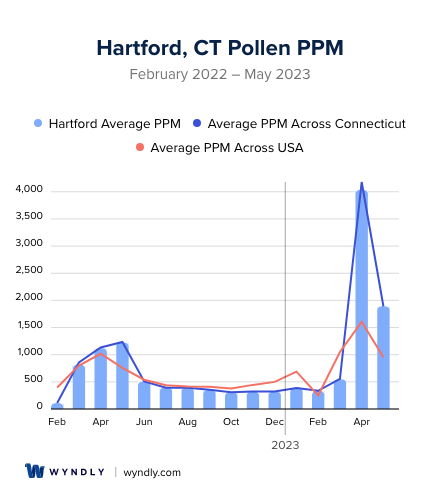
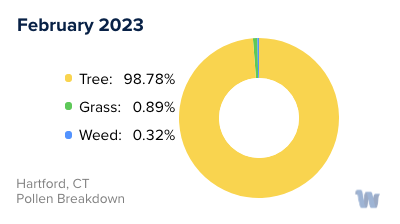
When is pollen lowest in Hartford, CT?
February
Lowest month total PPM
Avg. PPM
When is pollen highest in Hartford, CT?
April
Highest month total PPM
Avg. PPM
How does pollen in Hartford, CT compare to Connecticut?
Hartford has a lower average PPM than the state of Connecticut.
Hartford yearly avg PPM:
Connecticut yearly avg PPM:
How does pollen in Hartford, CT compare to the USA?
Hartford has a higher average PPM than the USA.
Hartford yearly avg PPM:
USA yearly avg PPM:
Is pollen worse this year in Hartford, CT?
Spring 2023 was worse than spring 2022.
Spring 2023 PPM:
Spring 2022 PPM:
Average PPM in Hartford, CT
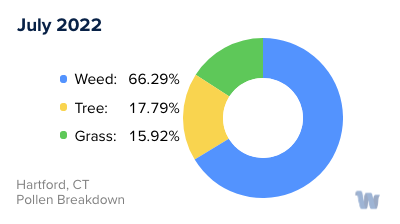
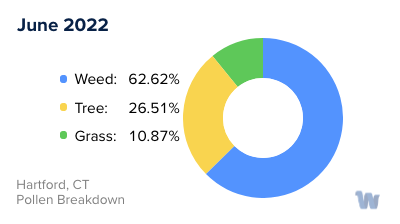
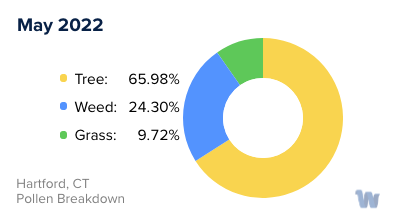
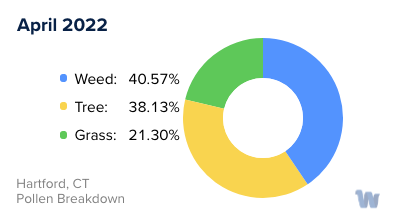
Hartford, CT Pollen and Allergy Breakdown by Month
Grass
When is grass pollen highest in Hartford, CT?
April has the highest grass pollen in Hartford, CT with an average PPM of
When is grass pollen lowest in Hartford, CT?
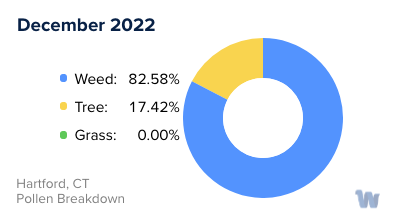
December has the lowest grass pollen in Hartford, CT with an average PPM of
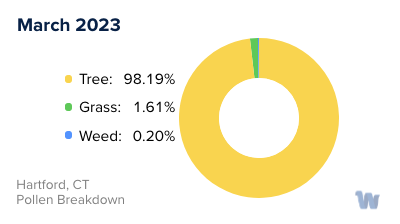
Tree
When is tree pollen highest in Hartford, CT?
April has the highest tree pollen in Hartford, CT with an average PPM of
When is tree pollen lowest in Hartford, CT?
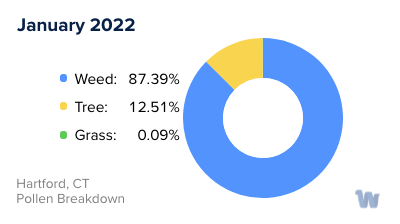
January has the lowest tree pollen in Hartford, CT with an average PPM of
Weed
When is weed pollen highest in Hartford, CT?
April has the highest weed pollen in Hartford, CT with an average PPM of
When is weed pollen lowest in Hartford, CT?
February has the lowest weed pollen in Hartford, CT with an average PPM of
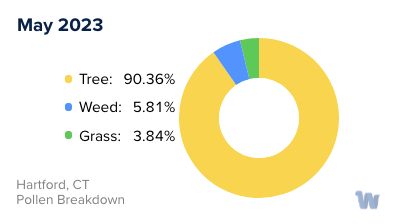
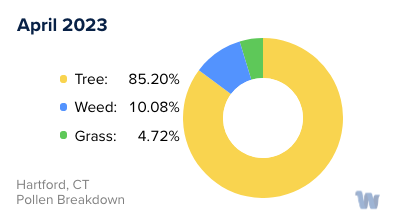
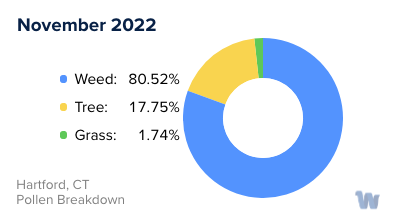
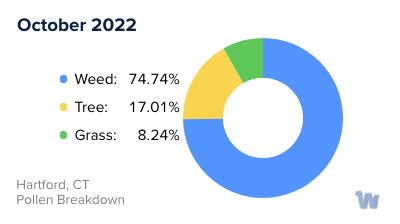
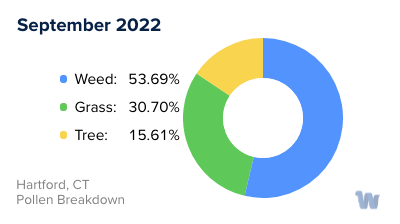
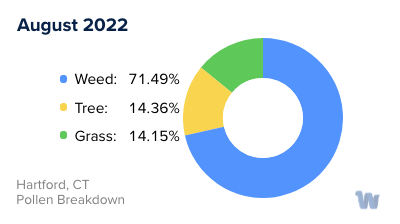
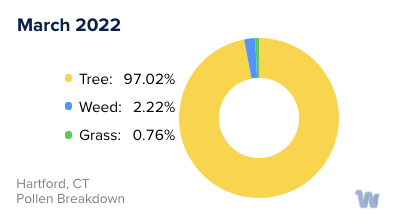
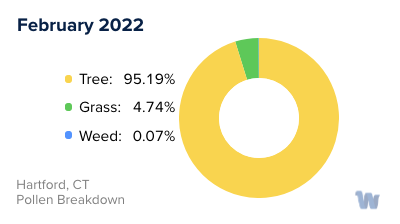
Hartford, CT Pollen Monthly Breakdown by Pollen Type
Pollen and Hay Fever in Hartford, CT
When spring and summer roll into Hartford, Connecticut, the city comes alive with beauty as flowers bloom, trees flourish, and the sun shines brighter. However, for those with pollen allergies, also known as hay fever, this scenic transformation can also signal the beginning of a challenging season.
Pollen allergies are reactions triggered by airborne pollen grains, invisible particles released by plants for reproduction. In Hartford, three main types of pollen can cause these allergic reactions: tree pollen, grass pollen, and weed pollen.
Tree pollen typically appears first in the year, usually from late March to early June. The primary culprits in Hartford are oak, cedar, pine, and birch trees. These trees release microscopic particles into the air, which, when inhaled, can cause symptoms like sneezing, runny or stuffy nose, and itchy or watery eyes in those who are allergic.
Next in the seasonal cycle, usually from late May to early July, is grass pollen. The common grasses in Hartford that produce allergy-inducing pollen include Timothy grass, Kentucky bluegrass, and ryegrass. These grasses are ubiquitous across the city, from lawns and parks to sports fields, making grass pollen allergies quite common.
Last to arrive, typically from late August to the first frost, is weed pollen. The main weeds contributing to pollen allergies in Hartford are ragweed, pigweed, and lamb's quarters. Ragweed is particularly notorious, as a single plant can release up to a billion grains of pollen in one season!,Living with pollen allergies in Hartford means adapting to the city's distinct pollen seasons. Understanding the pollen types and their seasonal timing can help individuals with allergies anticipate and navigate the challenges of the changing landscape. Remember, though, while pollen allergies can be uncomfortable, they're also a sign of the city's vibrant, living ecosystem.