Nampa, ID Pollen and Allergy Report for Summer 2023

Pollen Allergy Trends in Nampa, ID
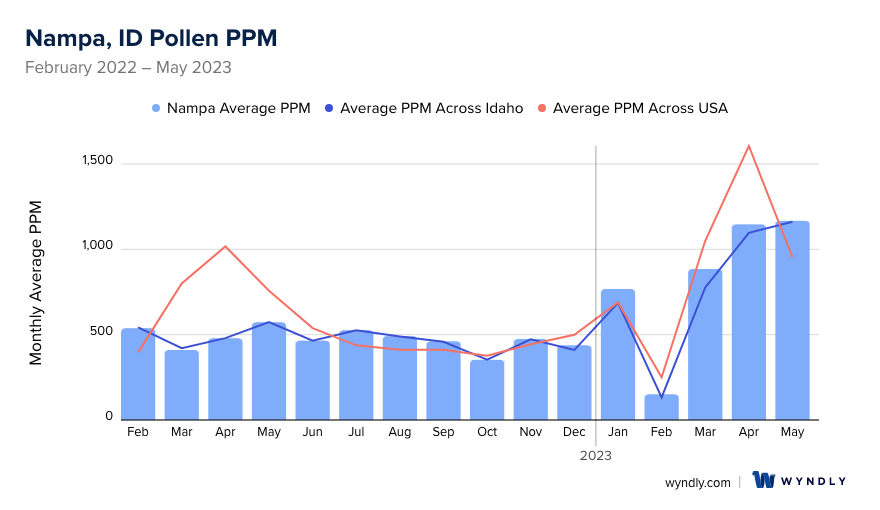
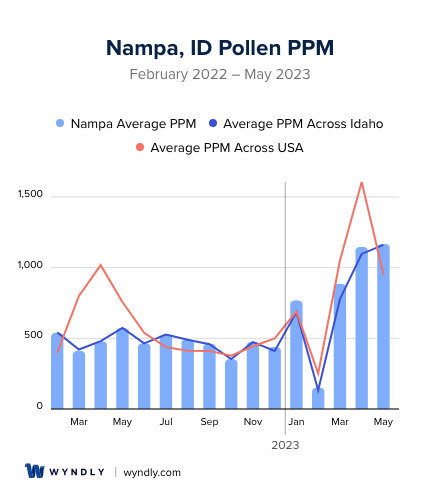
When is pollen lowest in Nampa, ID?
February
Lowest month total PPM
Avg. PPM
When is pollen highest in Nampa, ID?
May
Highest month total PPM
Avg. PPM
How does pollen in Nampa, ID compare to Idaho?
Nampa has a higher average PPM than the state of Idaho.
Nampa yearly avg PPM:
Idaho yearly avg PPM:
How does pollen in Nampa, ID compare to the USA?
Nampa has a lower average PPM than the USA.
Nampa yearly avg PPM:
USA yearly avg PPM:
Is pollen worse this year in Nampa, ID?
Spring 2023 was worse than spring 2022.
Spring 2023 PPM:
Spring 2022 PPM:
Average PPM in Nampa, ID
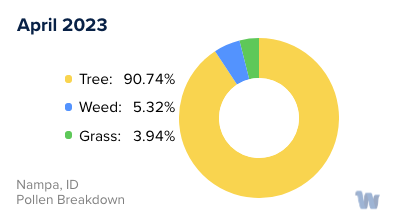
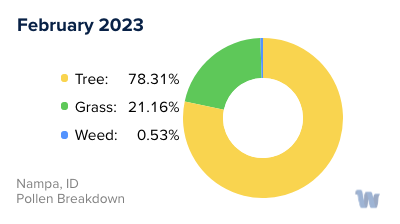
Nampa, ID Pollen and Allergy Breakdown by Month
Grass
When is grass pollen highest in Nampa, ID?
May has the highest grass pollen in Nampa, ID with an average PPM of
When is grass pollen lowest in Nampa, ID?
November has the lowest grass pollen in Nampa, ID with an average PPM of
Tree
When is tree pollen highest in Nampa, ID?
May has the highest tree pollen in Nampa, ID with an average PPM of
When is tree pollen lowest in Nampa, ID?
October has the lowest tree pollen in Nampa, ID with an average PPM of
Weed
When is weed pollen highest in Nampa, ID?
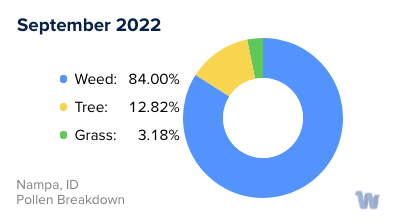
September has the highest weed pollen in Nampa, ID with an average PPM of
When is weed pollen lowest in Nampa, ID?
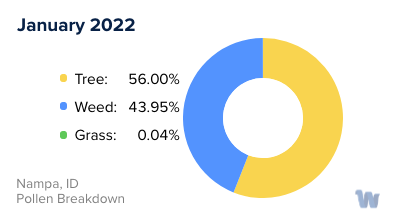
February has the lowest weed pollen in Nampa, ID with an average PPM of
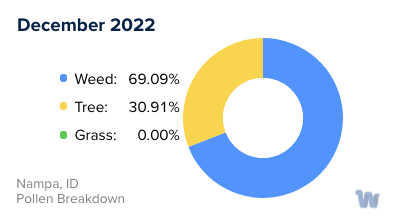
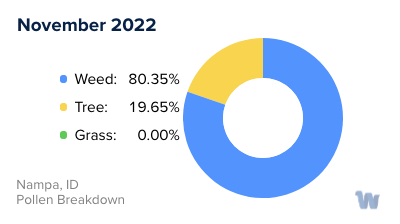
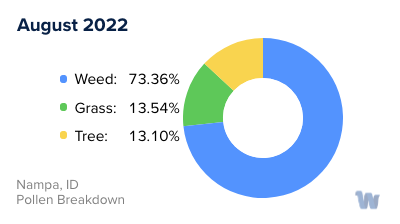
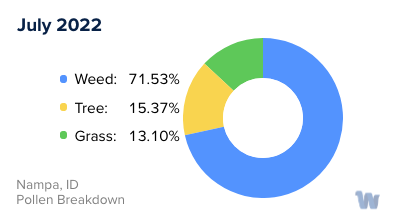
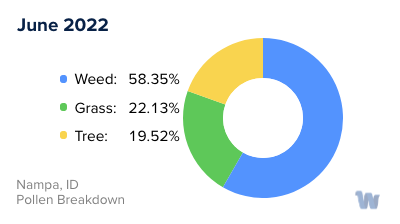
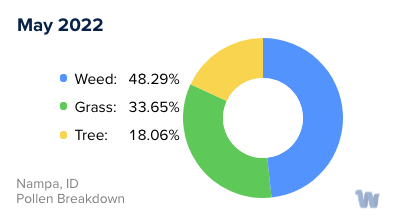
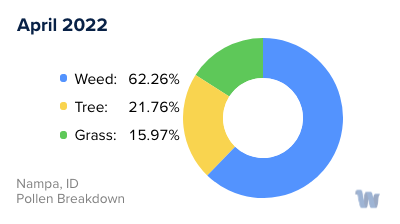
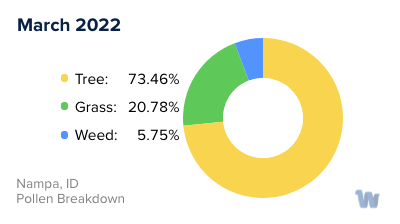
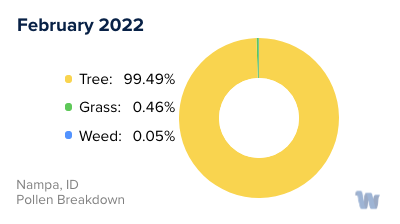
Nampa, ID Pollen Monthly Breakdown by Pollen Type


Pollen and Hay Fever in Nampa, ID
In Nampa, Idaho, pollen allergies, often referred to as hay fever, can be a significant concern for many residents. The city's diverse vegetation means a variety of pollens are released throughout the year, each with its peak season. Understanding these patterns can be an essential first step in managing one's allergies.
The primary offenders in Nampa are tree, grass, and ragweed pollens. Tree pollen, especially from willow, walnut, ash, mulberry, and maple trees, is most prevalent in spring. The warming temperatures stimulate these trees to release their pollen, usually starting around late February or early March. Cottonwood, juniper, and other trees can also contribute to the pollen count.
As spring gives way to summer, grass pollen takes the spotlight. Common sources include bluegrass and Bermuda, timothy, and orchard grasses. The grass pollen levels can be high to very high during this season, depending on the weather conditions and specific grass species present.
Finally, as summer fades into fall, weed pollens, particularly ragweed, sagebrush, and orache, become the main culprits. The season typically starts in August and continues until the first frost, usually around late October. This period is when ragweed pollen can be particularly troublesome for those who are sensitive to it.
However, it's important to note that pollen levels can vary from day to day and year to year, influenced by factors such as temperature, humidity, wind speed, and rainfall. Additionally, individual responses to different types of pollen can vary widely, with some people being more sensitive to certain types than others.
In conclusion, while living in Nampa, Idaho, one may encounter a wide range of pollens throughout the year, each with its own season and unique set of challenges. Knowing the types of pollen and their respective seasons can help residents better anticipate and understand their allergy symptoms.