Baltimore, MD Pollen and Allergy Report for Summer 2023

Pollen Allergy Trends in Baltimore, MD

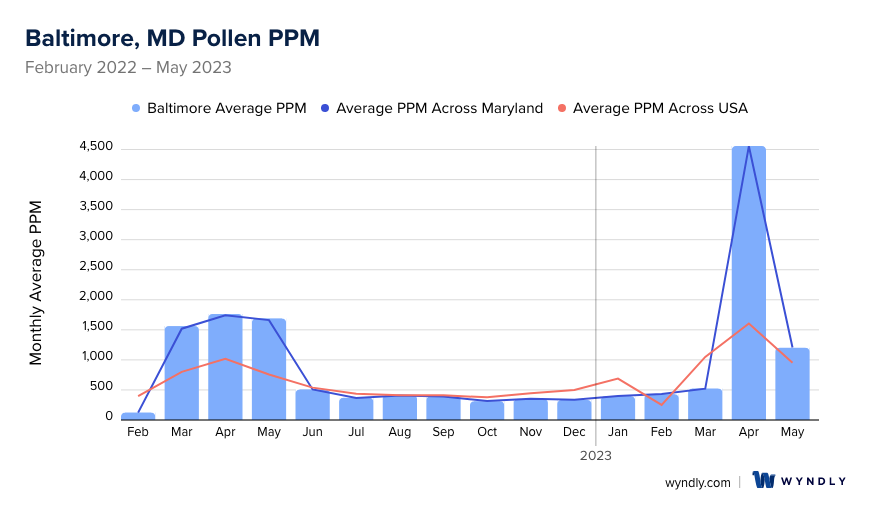
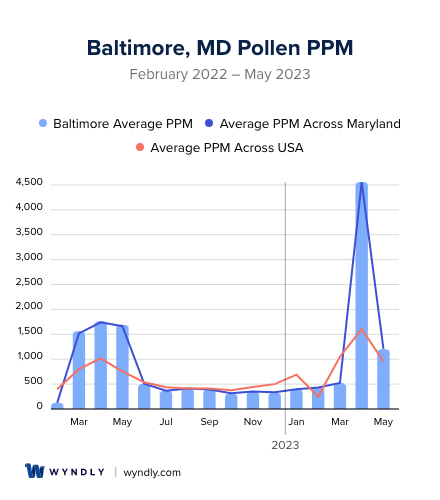
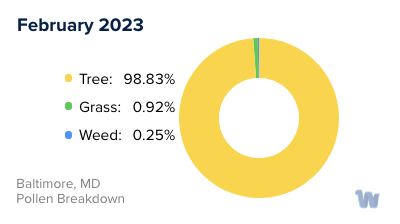
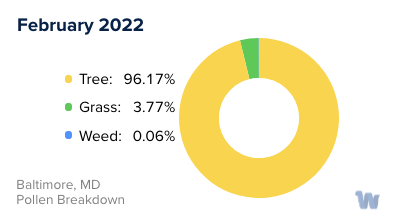
When is pollen lowest in Baltimore, MD?

Green down arrow

February

Lowest month total PPM

124.28 Avg. PPM

When is pollen highest in Baltimore, MD?

Red up arrow

April

Highest month total PPM

4,558.66 Avg. PPM

How does pollen in Baltimore, MD compare to Maryland?

Baltimore has a higher average PPM than the state of Maryland.

Baltimore yearly avg PPM: 933.39

Maryland yearly avg PPM: 927.83

How does pollen in Baltimore, MD compare to the USA?

Baltimore has a higher average PPM than the USA.

Baltimore yearly avg PPM: 933.39

USA yearly avg PPM: 664.86

Is pollen worse this year in Baltimore, MD?

Spring 2023 was worse than spring 2022.

Spring 2023 PPM: 6,284.57

Spring 2022 PPM: 5,016.56

Average PPM in Baltimore, MD

Baltimore, MD Average PPM Baltimore, MD Average PPM

Baltimore, MD Pollen and Allergy Breakdown by Month
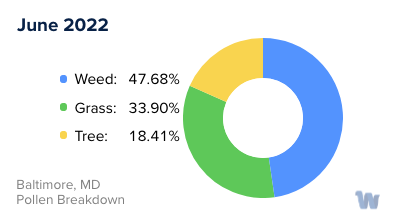
Grass

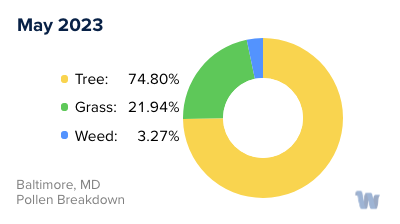
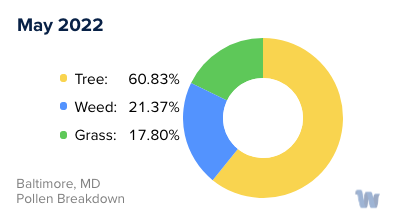
When is grass pollen highest in Baltimore, MD?

May has the highest grass pollen in Baltimore, MD with an average PPM of 300.88

When is grass pollen lowest in Baltimore, MD?

December has the lowest grass pollen in Baltimore, MD with an average PPM of
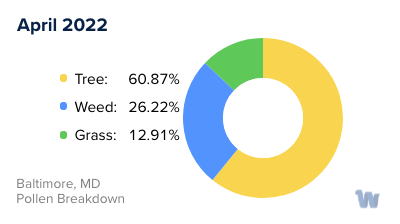
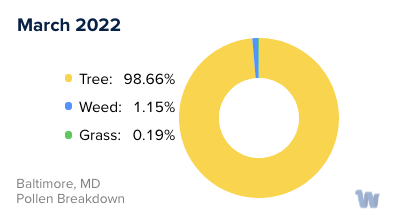
 0

Tree

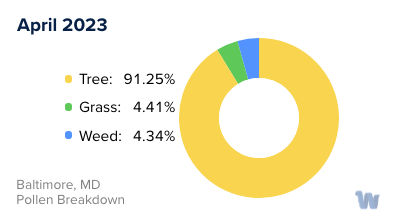
When is tree pollen highest in Baltimore, MD?

April has the highest tree pollen in Baltimore, MD with an average PPM of 4,159.83

When is tree pollen lowest in Baltimore, MD?

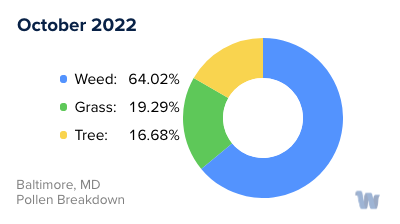
October has the lowest tree pollen in Baltimore, MD with an average PPM of 52.26

Weed

When is weed pollen highest in Baltimore, MD?

April has the highest weed pollen in Baltimore, MD with an average PPM of 462.35

When is weed pollen lowest in Baltimore, MD?

February has the lowest weed pollen in Baltimore, MD with an average PPM of 0.07

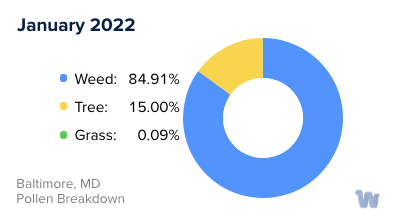
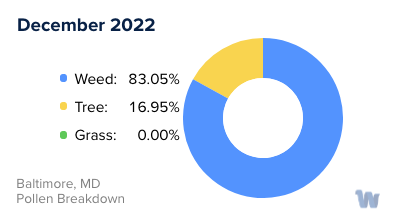
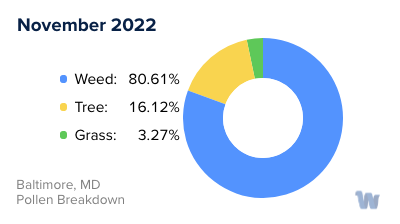
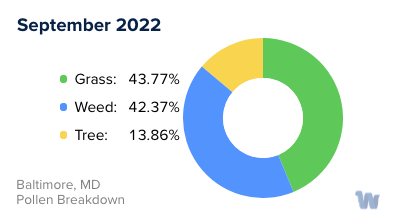
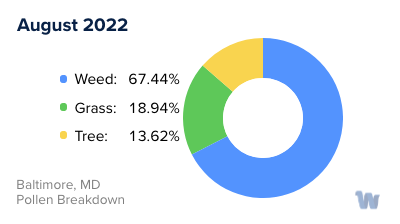
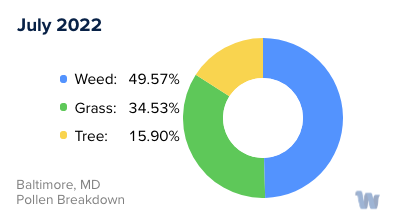
Baltimore, MD Pollen Monthly Breakdown by Pollen Type

Baltimore, MD Monthly Pollen Breakdown

Pollen and Hay Fever in Baltimore, MD

In Baltimore, Maryland, pollen allergies, also known as hay fever, can pose challenges throughout much of the year, typically flaring up in the spring, summer, and fall. The primary sources of pollen in the area are grasses, trees, and weeds, each contributing to the overall pollen count during different seasons.

Springtime, beginning late February or early March, ushers in the tree pollen season. Among the key contributors are oaks, hickories, ashes, and maples. These trees start to release their pollen, which can trigger allergic reactions among susceptible individuals. Spring allergies can be particularly severe due to Maryland's abundant plant life.

As spring transitions to summer, the main allergenic pollen source shifts from trees to grasses. Grass pollen, primarily produced by Bermuda grass, becomes more prevalent during the summer months, causing hay fever symptoms to persist.

In the fall, weed pollen takes center stage. Weeds such as wormwood, sagebrush, orache, and amaranth release their pollen, which can lead to a late-summer to fall surge in allergy symptoms. The weed pollen season typically lasts until the first frost, usually around November. This marks the end of the major outdoor allergy season in Baltimore, giving residents a reprieve from seasonal allergies until the following spring.

Throughout the year, but especially in April, June, and September, those affected by pollen allergies should be aware of the pollen count. These are the months when seasonal allergies typically peak. Despite the challenges posed by these allergens, Baltimore's diverse flora contributes to the charm and beauty of the city, and understanding the pollen seasons can help residents and visitors anticipate and navigate the allergenic landscape.

Baltimore, MD Map

What is Wyndly?

Wyndly is the easiest and most convenient way to fix your allergies forever. As an online allergy practice, Wyndly offers at-home allergy testing and treatment. The main goal of Wyndly is to retrain the immune system to stop responding to allergens, providing lasting relief from allergies.

Here's how Wyndly works:

  1. Identify Allergy Triggers: The first step is to identify the allergy triggers. You can purchase an at-home allergy test from Wyndly, or if you have already done an allergy test elsewhere, you can share your existing test results. This allows the doctors at Wyndly to pinpoint which allergies need to be treated.
  2. Get Treated by a Real Doctor: Using medications that are similar to those used in allergy shots, a doctor creates a unique sublingual immunotherapy treatment plan to desensitize your immune system. This is done using FDA-approved sublingual tablets or clinically proven dosing for oral use.
  3. Live Better Without Symptoms: The prescriptions are shipped to your door, and the doctor works with you until you’re better. Wyndly offers regular online check-ins with US-licensed physicians and 24/7 availability for questions or concerns via text, email, or call.

The treatment plans are personalized based on your specific allergy triggers and aim to treat allergies at their source, rather than just relieving symptoms for a short period. Most people report improvement in as little as one month.

Start with Wyndly today

Wyndly Summer 2023 Pollen Report Methodology

For each city, Wyndly obtained monthly pollen PPMs (pollen grains per cubic meter) for each form (tree, grass, and weed) from February 2022 - May 2023. Data were obtained from Pollen Sense, LLC Automated Particulate Sensors (APS). These sensors automatically detect particulate matter collected from ambient air, and use a neural network algorithm to identify individual pollen species and calculate daily pollen counts.

Yearly averages are calculated by summing the three allergen averages per month of data for a total monthly PPM, summing all monthly total PPMs, then dividing by 12 (month count). Used for per-city average, state average, and total USA average. Season comparisons are done by summing the months of Spring (March, April, May) for 2023 and 2022. If the absolute of the (2023-2022)/2022 is ≤ 0.05, the years were about the same. Otherwise, the more PPM, the worse the season was.

Is Wyndly right for you?

Answer just a few questions and we'll help you find out.

Get Started Today

Pollen and Allergy Reports by City