Bridgeport, CT Pollen and Allergy Report for Summer 2023

Pollen Allergy Trends in Bridgeport, CT
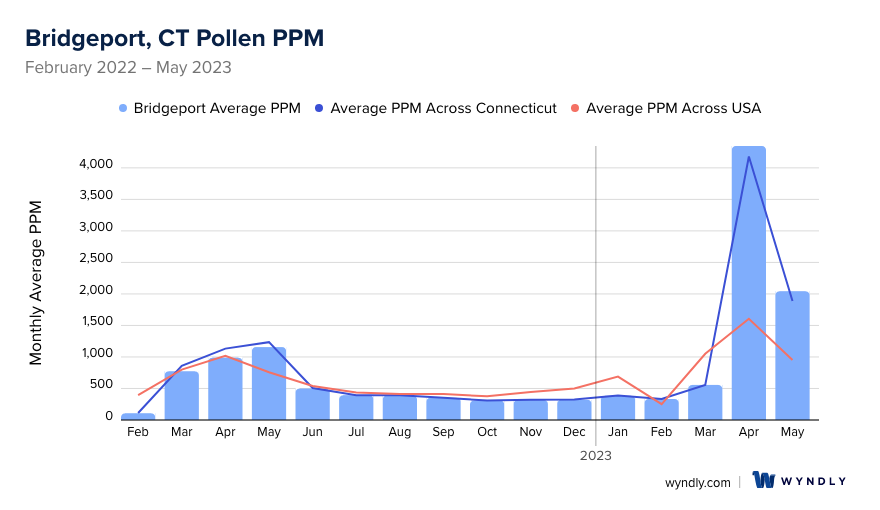
When is pollen lowest in Bridgeport, CT?
February
Lowest month total PPM
Avg. PPM
When is pollen highest in Bridgeport, CT?
April
Highest month total PPM
Avg. PPM
How does pollen in Bridgeport, CT compare to Connecticut?
Bridgeport has a lower average PPM than the state of Connecticut.
Bridgeport yearly avg PPM:
Connecticut yearly avg PPM:
How does pollen in Bridgeport, CT compare to the USA?
Bridgeport has a higher average PPM than the USA.
Bridgeport yearly avg PPM:
USA yearly avg PPM:
Is pollen worse this year in Bridgeport, CT?
Spring 2023 was worse than spring 2022.
Spring 2023 PPM:
Spring 2022 PPM:
Average PPM in Bridgeport, CT
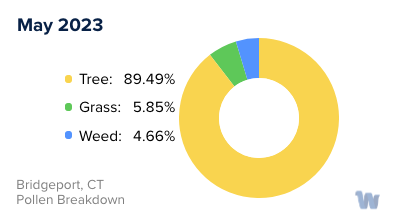
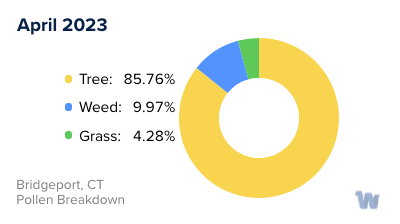
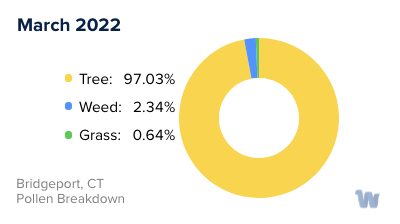
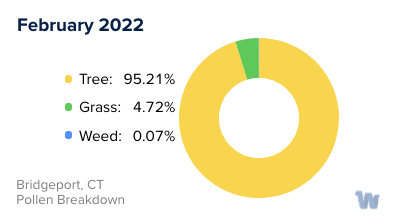
Bridgeport, CT Pollen and Allergy Breakdown by Month
Grass
When is grass pollen highest in Bridgeport, CT?
April has the highest grass pollen in Bridgeport, CT with an average PPM of
When is grass pollen lowest in Bridgeport, CT?
December has the lowest grass pollen in Bridgeport, CT with an average PPM of
Tree
When is tree pollen highest in Bridgeport, CT?
April has the highest tree pollen in Bridgeport, CT with an average PPM of
When is tree pollen lowest in Bridgeport, CT?
January has the lowest tree pollen in Bridgeport, CT with an average PPM of
Weed
When is weed pollen highest in Bridgeport, CT?
April has the highest weed pollen in Bridgeport, CT with an average PPM of
When is weed pollen lowest in Bridgeport, CT?
February has the lowest weed pollen in Bridgeport, CT with an average PPM of
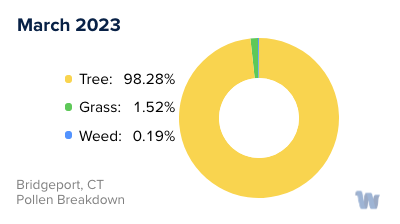
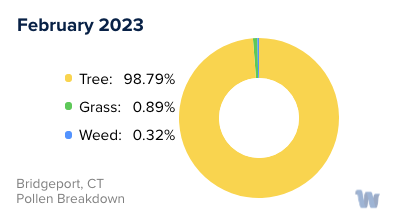
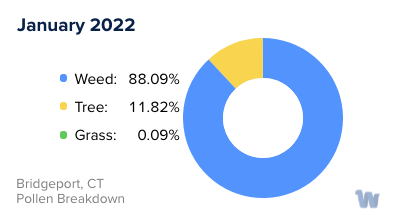
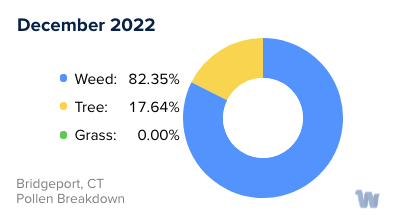
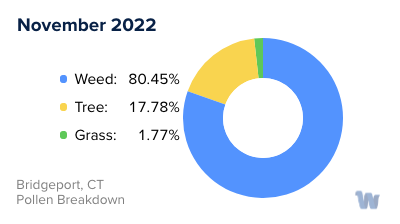
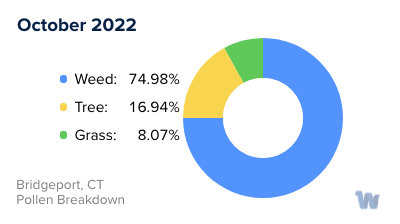
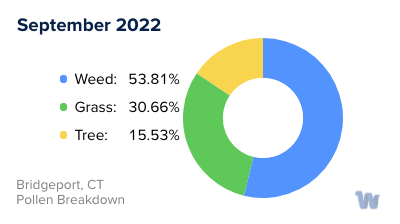
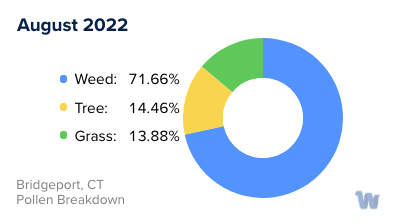
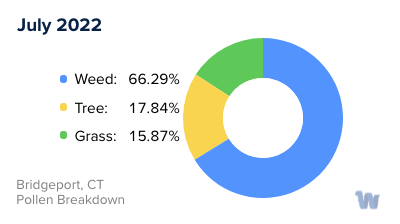
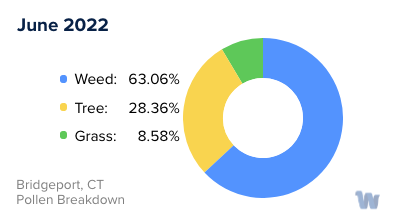
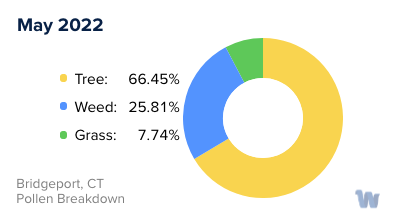
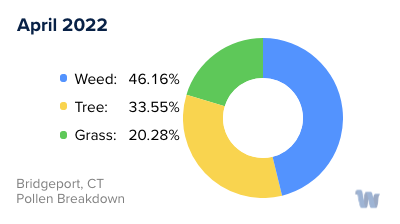
Bridgeport, CT Pollen Monthly Breakdown by Pollen Type
Pollen and Hay Fever in Bridgeport, CT
When it comes to pollen allergies and hay fever, Bridgeport, Connecticut, is no stranger to these conditions. With the arrival of spring, residents are starting to experience the telltale symptoms of seasonal allergies. What's more, allergy season is kicking off earlier than usual, with patients reporting symptoms as early as February, a month ahead of the typical start in March.
Connecticut's warmer-than-usual winter conditions have paved the way for a longer and more intense allergy season. As the snow melts and the weather grows humid, plants that produce airborne pollen start to flourish. This combination of moisture and warmth creates the perfect environment for a robust spring season of pollen production.
As for the types of pollen causing discomfort, airborne pollen is the most common culprit. While many might point fingers at flowering plants when their symptoms flare up, the pollen from these blooming beauties is usually not airborne. Instead, it is carried from flower to flower by insects like honeybees and butterflies, as well as birds and bats. It's the less conspicuous plants, those without showy flowers, that are responsible for releasing pollen grains into the air.
Trees are often the leading cause of spring allergy symptoms, which can include itchy and watery eyes, a runny nose, and fatigue. Many individuals find that their allergies peak in May, when early spring trees, mold, grass, and weeds all pollinate simultaneously. As such, May and June are peak months for grass pollen, making this period particularly challenging for those susceptible to hay fever.
Interestingly, even when local plants aren't in bloom, residents can still experience allergy symptoms. Warmer weather fronts can bring early pollen from other areas, leading to a low to mid-range pollen count in most parts of Connecticut. This phenomenon helps explain why allergy symptoms can persist even outside of the typical pollen seasons.
In 2022, Bridgeport, along with New Haven and Hartford, was ranked among the country's most challenging places to live with seasonal allergies. As we move through 2023, residents are bracing for a potentially longer and more intense allergy season, a testament to the city's reputation as a hotspot for pollen allergies and hay fever.