Garden Grove, CA Pollen and Allergy Report for Summer 2023

Pollen Allergy Trends in Garden Grove, CA
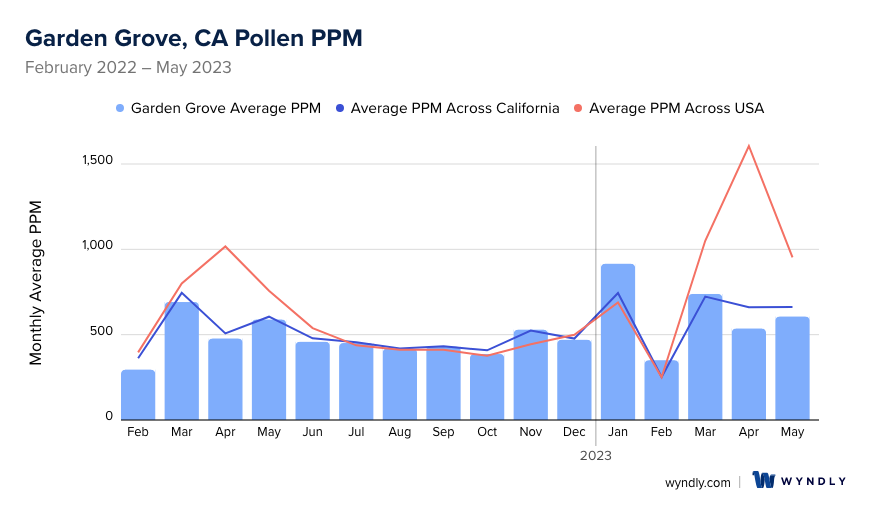
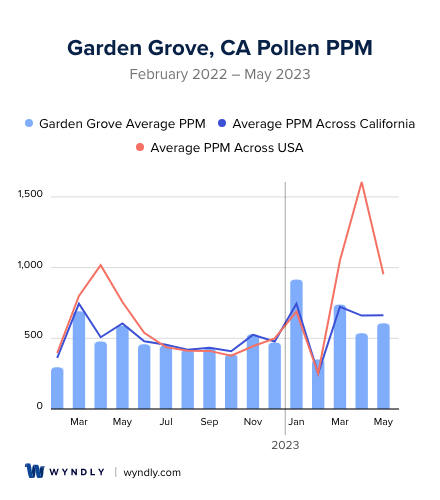
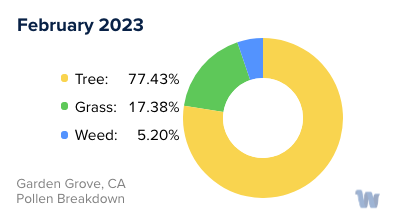
When is pollen lowest in Garden Grove, CA?
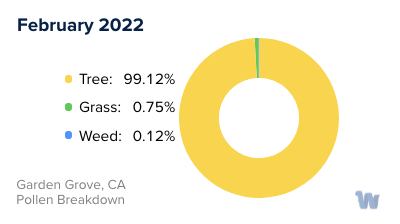
February
Lowest month total PPM
Avg. PPM
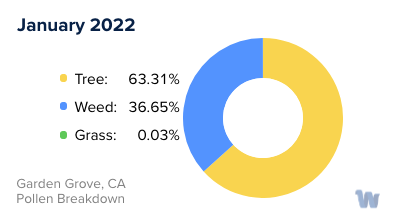
When is pollen highest in Garden Grove, CA?
January
Highest month total PPM
Avg. PPM
How does pollen in Garden Grove, CA compare to California?
Garden Grove has a lower average PPM than the state of California.
Garden Grove yearly avg PPM:
California yearly avg PPM:
How does pollen in Garden Grove, CA compare to the USA?
Garden Grove has a lower average PPM than the USA.
Garden Grove yearly avg PPM:
USA yearly avg PPM:
Is pollen worse this year in Garden Grove, CA?
Spring 2023 was worse than spring 2022.
Spring 2023 PPM:
Spring 2022 PPM:
Average PPM in Garden Grove, CA
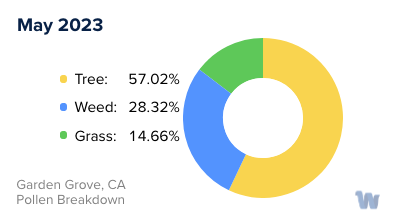
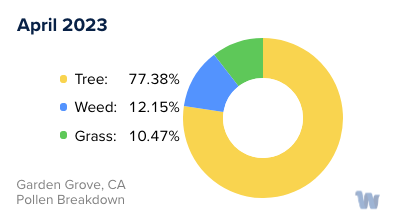
Garden Grove, CA Pollen and Allergy Breakdown by Month
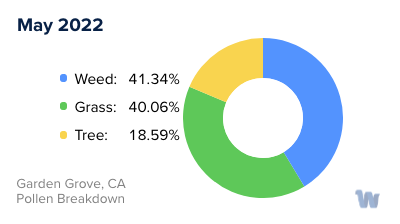
Grass
When is grass pollen highest in Garden Grove, CA?
May has the highest grass pollen in Garden Grove, CA with an average PPM of
When is grass pollen lowest in Garden Grove, CA?
December has the lowest grass pollen in Garden Grove, CA with an average PPM of
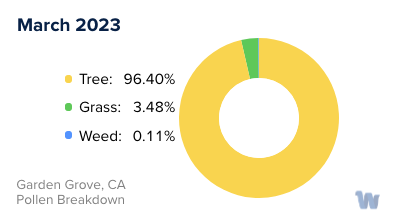
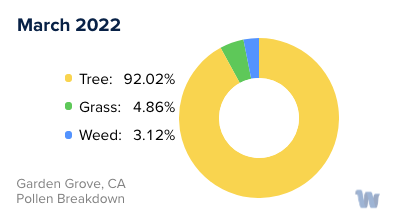
Tree
When is tree pollen highest in Garden Grove, CA?
March has the highest tree pollen in Garden Grove, CA with an average PPM of
When is tree pollen lowest in Garden Grove, CA?
August has the lowest tree pollen in Garden Grove, CA with an average PPM of
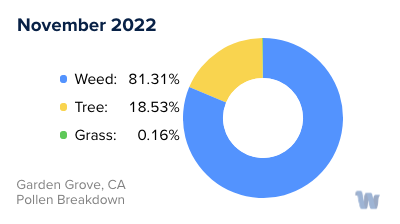
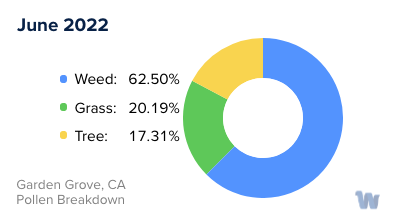
Weed
When is weed pollen highest in Garden Grove, CA?
November has the highest weed pollen in Garden Grove, CA with an average PPM of
When is weed pollen lowest in Garden Grove, CA?
February has the lowest weed pollen in Garden Grove, CA with an average PPM of
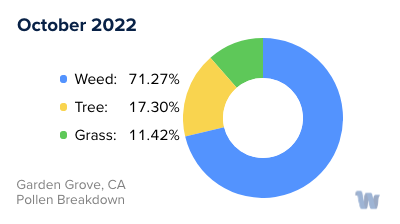
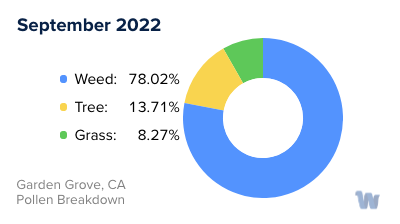
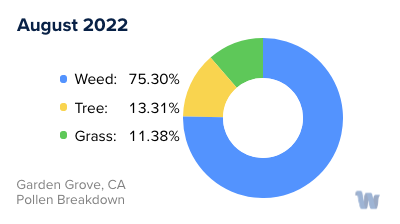
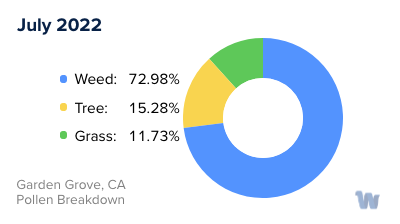
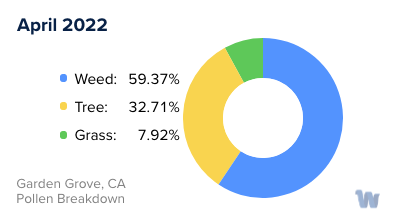
Garden Grove, CA Pollen Monthly Breakdown by Pollen Type

Pollen and Hay Fever in Garden Grove, CA
In the charming city of Garden Grove, California, pollen allergies, commonly known as hay fever, can be a cause for discomfort for many. The Golden State has a fairly warm climate throughout the year, but with a more coastal influence, the pollen counts tend to be slightly lower than other states with similar weather conditions. Nevertheless, the residents of Garden Grove still experience seasonal allergies, with the main type of pollen being weed.
In California, the producers of pollen are primarily grasses, trees, and weeds. Some of the most common allergens in the area include bluegrass, ryegrass, sagebrush, ragweed, Russian thistle, mulberry, oak, olive, ash, cedar, and eucalyptus. It’s important to know that depending on the type of allergen, residents can experience allergy symptoms at different times of the year.
Pollen allergies typically flare up in the spring, summer, and fall. In California, the allergy season starts around late January and extends until early October, owing to the milder winters. This makes the allergy season longer than in many other states. However, the climate in California can be somewhat more tolerable for allergy sufferers.
April, May, and September are the months when pollen counts peak, and seasonal allergies are at their height. During these months, it’s advisable for pollen-sensitive individuals to be cautious about the time they spend outdoors.
In Garden Grove, like the rest of California, the weed pollen levels can range from low to very high. When the levels are low, there is limited risk to pollen-sensitive individuals. However, as the levels rise, individuals sensitive to weed pollen might experience more severe allergic reactions.
In conclusion, residents of Garden Grove should be aware of the different types of pollen and the seasons in which they are prevalent to manage their allergies effectively.