Evansville, IN Pollen and Allergy Report for Summer 2023

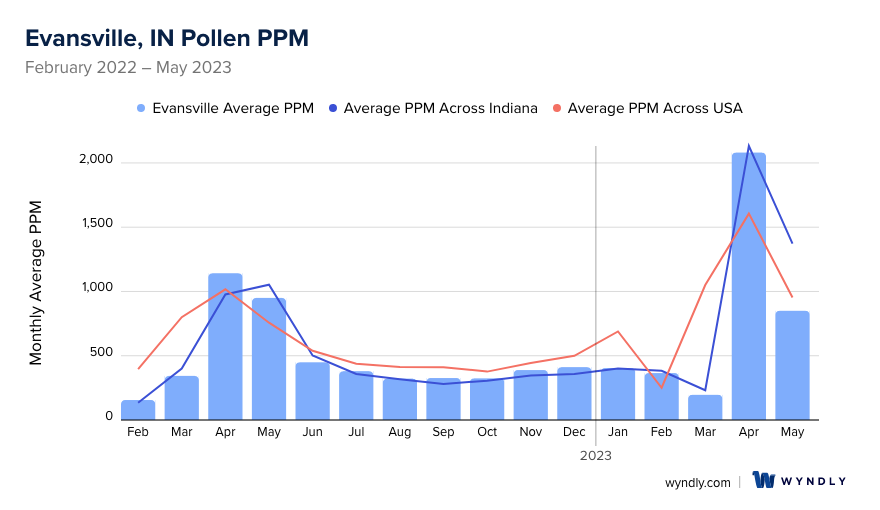
Pollen Allergy Trends in Evansville, IN
When is pollen lowest in Evansville, IN?
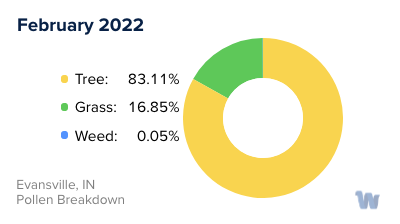
February
Lowest month total PPM
Avg. PPM
When is pollen highest in Evansville, IN?
April
Highest month total PPM
Avg. PPM
How does pollen in Evansville, IN compare to Indiana?
Evansville has a lower average PPM than the state of Indiana.
Evansville yearly avg PPM:
Indiana yearly avg PPM:
How does pollen in Evansville, IN compare to the USA?
Evansville has a lower average PPM than the USA.
Evansville yearly avg PPM:
USA yearly avg PPM:
Is pollen worse this year in Evansville, IN?
Spring 2023 was worse than spring 2022.
Spring 2023 PPM:
Spring 2022 PPM:
Average PPM in Evansville, IN
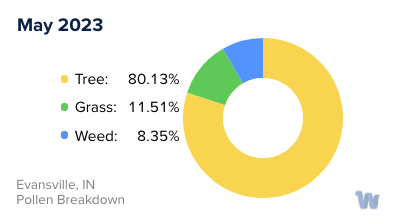
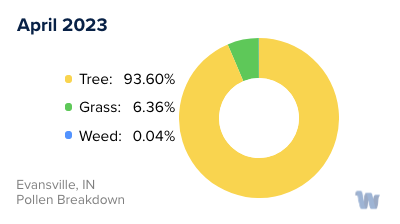
Evansville, IN Pollen and Allergy Breakdown by Month
Grass
When is grass pollen highest in Evansville, IN?
April has the highest grass pollen in Evansville, IN with an average PPM of
When is grass pollen lowest in Evansville, IN?
October has the lowest grass pollen in Evansville, IN with an average PPM of
Tree
When is tree pollen highest in Evansville, IN?
April has the highest tree pollen in Evansville, IN with an average PPM of
When is tree pollen lowest in Evansville, IN?
July has the lowest tree pollen in Evansville, IN with an average PPM of
Weed
When is weed pollen highest in Evansville, IN?
April has the highest weed pollen in Evansville, IN with an average PPM of
When is weed pollen lowest in Evansville, IN?
February has the lowest weed pollen in Evansville, IN with an average PPM of
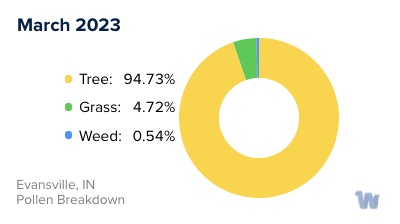
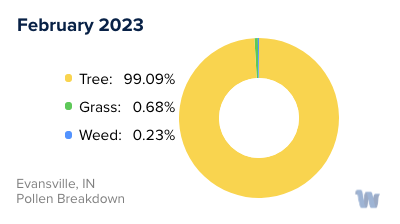
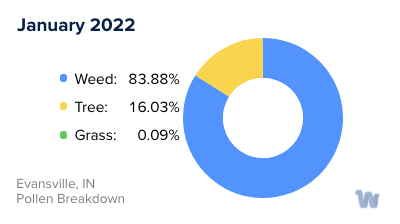
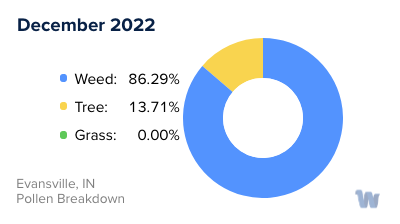
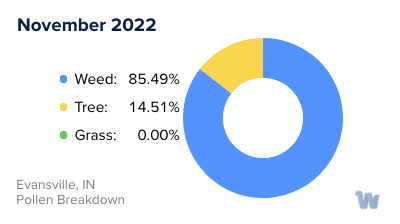
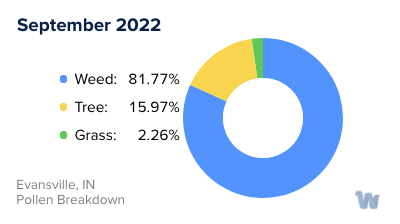
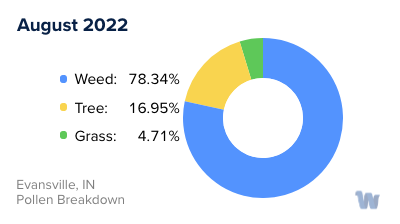
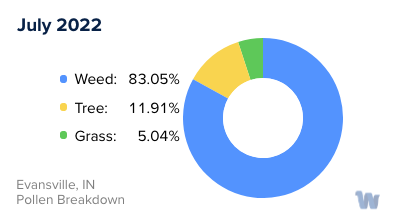
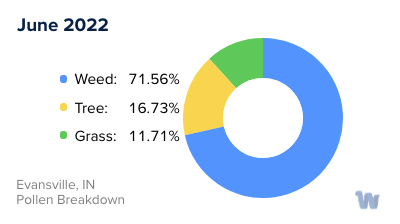
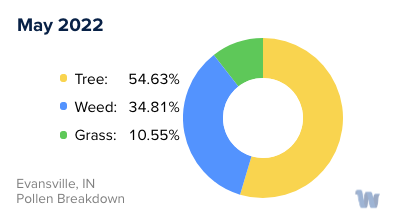
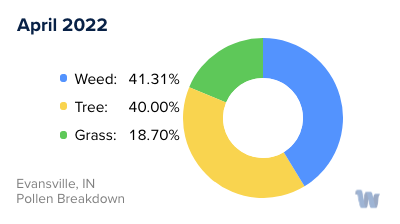
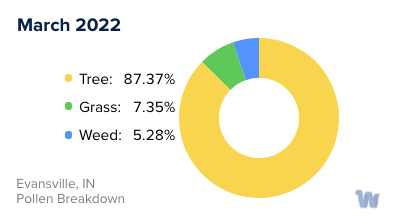
Evansville, IN Pollen Monthly Breakdown by Pollen Type

Pollen and Hay Fever in Evansville, IN
For residents of Evansville, Indiana, pollen allergies have become an increasingly noticeable concern. The sources of this annoyance are primarily trees in the spring and ragweed in the fall. Over recent years, the lack of late deep freezes has meant longer pollen seasons and more pollen in the air, intensifying allergies for many.
The spring allergy season kicks off with a surge of tree pollen. Tree pollen usually starts in late winter in the southernmost states and reaches problem levels by mid-March, persisting through June. The moderate temperatures and multiple rounds of rain in the Southeast, including the Evansville-Henderson area, exacerbate this issue. While one might hope that rain would help by washing the pollen out of the air, unfortunately, the expected rounds of early spring rain are unlikely to be sufficient to significantly reduce pollen levels. Thus, tree pollen levels are predicted to stay high in March and April.
As we move into the warmer months, grass takes over as the main pollen producer. Mild temperatures and ample moisture create an ideal environment for grass to grow, leading to higher-than-average grass pollen levels in the Southeast from April to June.
By the time tree and grass pollen levels settle down in June, weed pollen, especially ragweed, ramps up. This extends the allergy season through the summer and well into fall. Although forecasts call for average weed pollen levels in the Evansville-Henderson area, it is worth noting that levels are expected to be high throughout most of the Southeast and East Coast.
In addition, rising carbon dioxide levels are contributing to rising temperatures, leading to longer growing seasons. This in turn leads to plants producing more pollen, exacerbating the allergy symptoms many people experience, such as runny noses, sneezing, itchy eyes, ears, and mouth, stuffy noses, red and watery eyes, and swelling around the eyes.
In conclusion, for those living in Evansville, Indiana, understanding the pollen seasons and types can be key to better managing the discomfort of allergies.