Fishers, IN Pollen and Allergy Report for Summer 2023

Pollen Allergy Trends in Fishers, IN
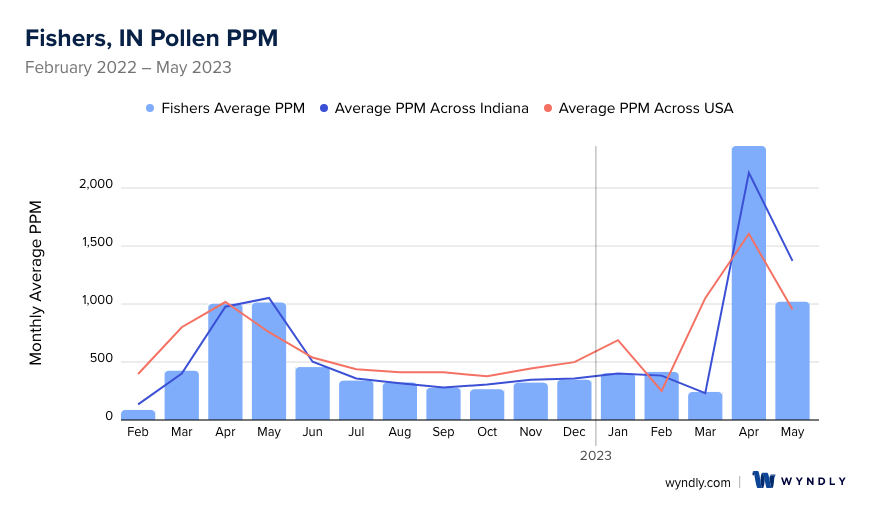
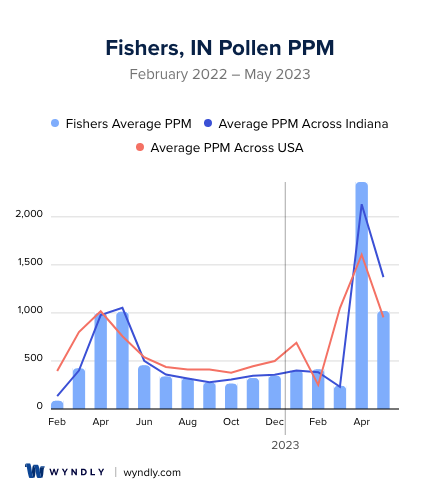
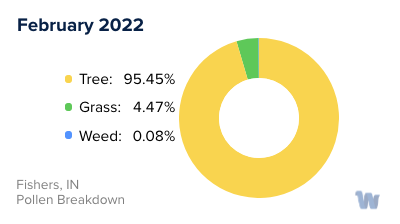
When is pollen lowest in Fishers, IN?
February
Lowest month total PPM
Avg. PPM
When is pollen highest in Fishers, IN?
April
Highest month total PPM
Avg. PPM
How does pollen in Fishers, IN compare to Indiana?
Fishers has a lower average PPM than the state of Indiana.
Fishers yearly avg PPM:
Indiana yearly avg PPM:
How does pollen in Fishers, IN compare to the USA?
Fishers has a lower average PPM than the USA.
Fishers yearly avg PPM:
USA yearly avg PPM:
Is pollen worse this year in Fishers, IN?
Spring 2023 was worse than spring 2022.
Spring 2023 PPM:
Spring 2022 PPM:
Average PPM in Fishers, IN
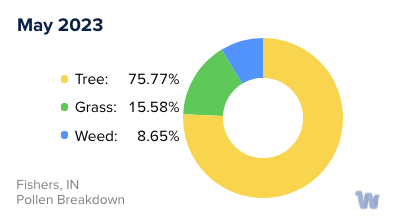
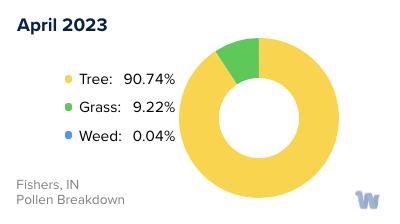
Fishers, IN Pollen and Allergy Breakdown by Month
Grass
When is grass pollen highest in Fishers, IN?
April has the highest grass pollen in Fishers, IN with an average PPM of
When is grass pollen lowest in Fishers, IN?
September has the lowest grass pollen in Fishers, IN with an average PPM of
Tree
When is tree pollen highest in Fishers, IN?
April has the highest tree pollen in Fishers, IN with an average PPM of
When is tree pollen lowest in Fishers, IN?
July has the lowest tree pollen in Fishers, IN with an average PPM of
Weed
When is weed pollen highest in Fishers, IN?
April has the highest weed pollen in Fishers, IN with an average PPM of
When is weed pollen lowest in Fishers, IN?
February has the lowest weed pollen in Fishers, IN with an average PPM of
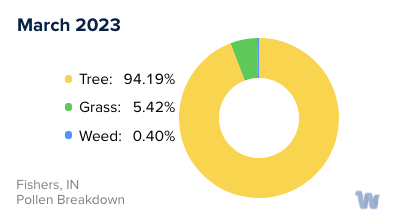
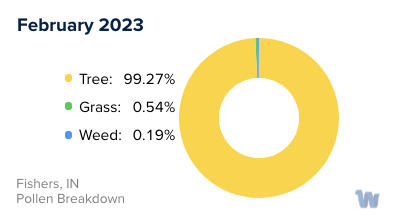
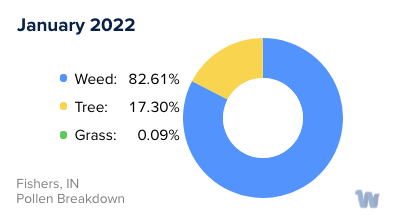
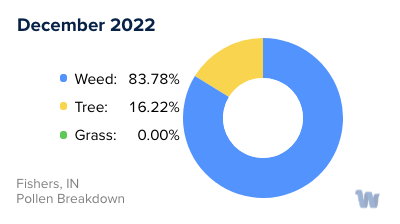
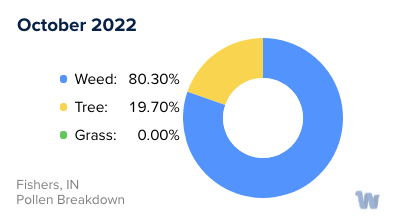
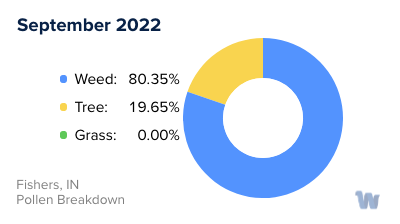
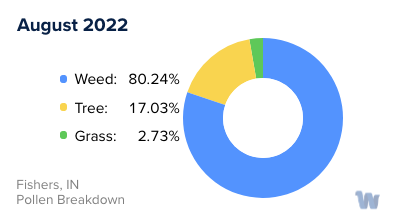
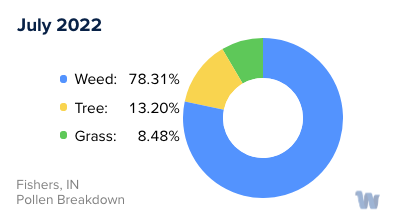
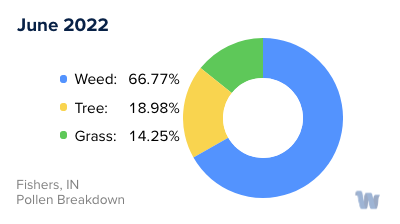
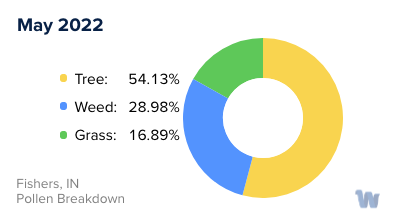
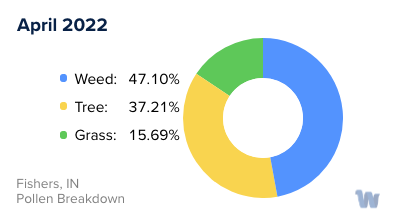
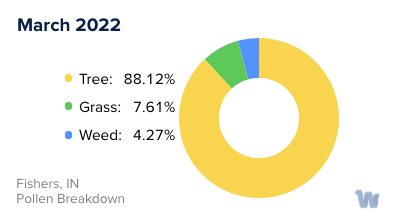
Fishers, IN Pollen Monthly Breakdown by Pollen Type

Pollen and Hay Fever in Fishers, IN
In Fishers, Indiana, the delicate dance between nature and our immune systems is a year-round performance. Pollen allergies, commonly known as hay fever, can be a constant companion for some residents, from the blooming of the first buds in spring to the last leaf's fall in autumn.
Pollen allergies in Fishers primarily stem from three sources: trees, grasses, and weeds. Each of these has its own 'season', a time of year when their pollen is most prevalent in the air.
Tree pollen takes the stage first, marking the beginning of allergy season in late February or early March. It is the primary allergen throughout spring, with certain tree species such as oak, birch, and elm being particularly potent triggers for hay fever.
As the weather warms and summer arrives, grass pollen enters the spotlight. This typically occurs during the summer months. Types of grasses like bent grass, fescue grass, orchard grass, and Johnson grass, common in the Fishers landscape, release their pollen and can exacerbate allergy symptoms.
Finally, as summer transitions into fall, weed pollen, particularly from ragweed, wormwood, cocklebur, and amaranth, becomes the main offender. These allergies can intensify from late summer and persist until the end of the allergy season.
April, May, and September are crucial months to be aware of in Fishers, as these are typically when seasonal allergies reach their peak. It's during these months that the 'ballet' of pollen and immune responses reaches its crescendo, affecting the daily lives of those susceptible to these allergens.
Living with pollen allergies in Fishers, Indiana, is about understanding the rhythm of nature's cycles and how they interact with our bodies. By recognizing the types of pollen and their respective seasons, individuals can better anticipate and navigate their allergy symptoms throughout the year, making the most of life in this vibrant Midwestern city.