Hillsboro, OR Pollen and Allergy Report for Summer 2023

Pollen Allergy Trends in Hillsboro, OR
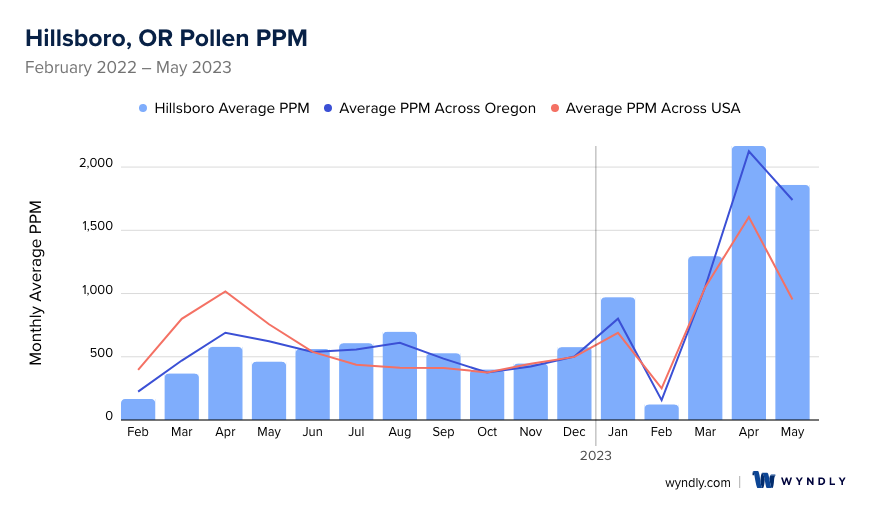
When is pollen lowest in Hillsboro, OR?
February
Lowest month total PPM
Avg. PPM
When is pollen highest in Hillsboro, OR?
April
Highest month total PPM
Avg. PPM
How does pollen in Hillsboro, OR compare to Oregon?
Hillsboro has a higher average PPM than the state of Oregon.
Hillsboro yearly avg PPM:
Oregon yearly avg PPM:
How does pollen in Hillsboro, OR compare to the USA?
Hillsboro has a higher average PPM than the USA.
Hillsboro yearly avg PPM:
USA yearly avg PPM:
Is pollen worse this year in Hillsboro, OR?
Spring 2023 was worse than spring 2022.
Spring 2023 PPM:
Spring 2022 PPM:
Average PPM in Hillsboro, OR
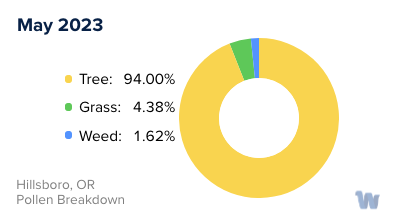
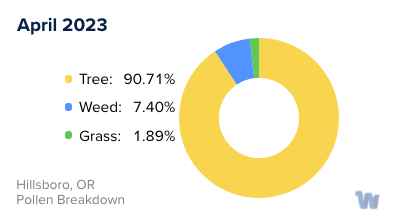
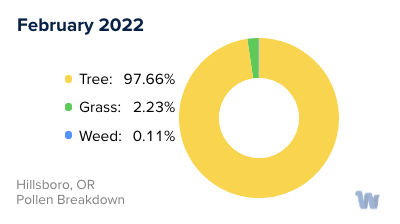
Hillsboro, OR Pollen and Allergy Breakdown by Month
Grass
When is grass pollen highest in Hillsboro, OR?
March has the highest grass pollen in Hillsboro, OR with an average PPM of
When is grass pollen lowest in Hillsboro, OR?
December has the lowest grass pollen in Hillsboro, OR with an average PPM of
Tree
When is tree pollen highest in Hillsboro, OR?
April has the highest tree pollen in Hillsboro, OR with an average PPM of
When is tree pollen lowest in Hillsboro, OR?
April has the lowest tree pollen in Hillsboro, OR with an average PPM of
Weed
When is weed pollen highest in Hillsboro, OR?
August has the highest weed pollen in Hillsboro, OR with an average PPM of
When is weed pollen lowest in Hillsboro, OR?
February has the lowest weed pollen in Hillsboro, OR with an average PPM of
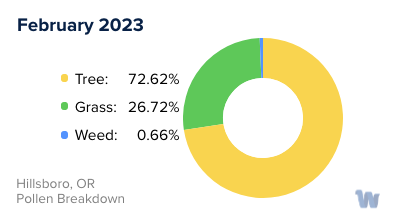
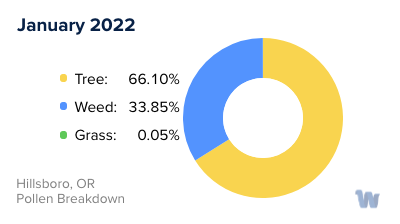
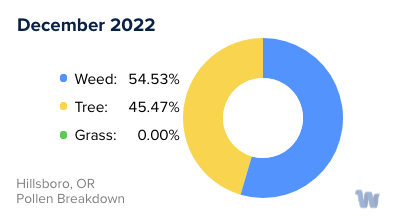
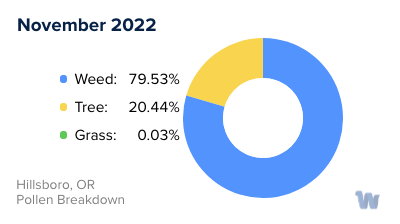
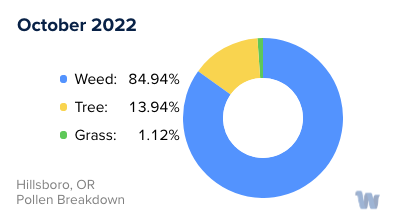
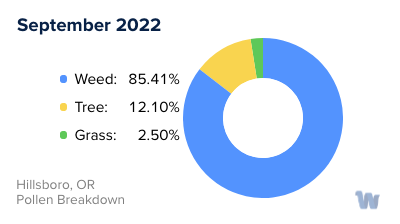
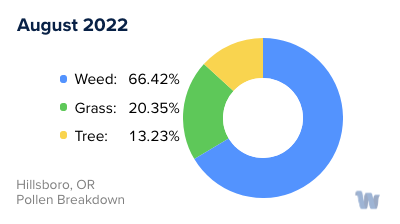
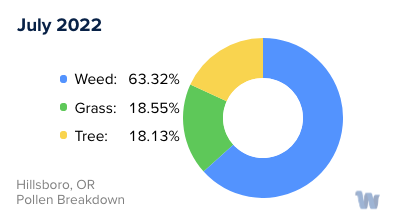
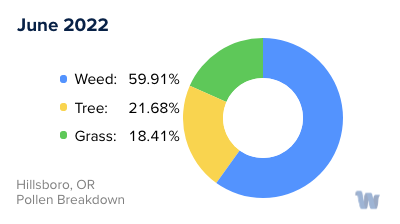
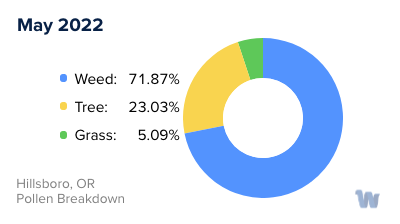
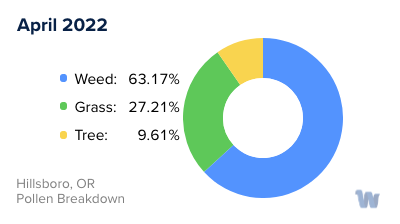
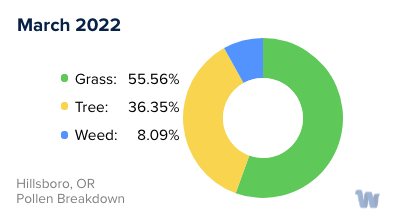
Hillsboro, OR Pollen Monthly Breakdown by Pollen Type

Pollen and Hay Fever in Hillsboro, OR
Pollen allergies, also known as hay fever, are a common issue for many residents of Hillsboro, Oregon. They're caused by an immune response to the tiny, airborne particles released by plants for reproduction.
In Hillsboro, the types of pollen that most commonly cause allergies include tree pollen, grass pollen, and ragweed pollen. The levels of these pollens can vary throughout the year, with some types being more prevalent in certain seasons than others.
Tree pollen, which includes species like oak, birch, cedar, maple, and pine, usually begins to appear in the air from as early as January, and continues to be present until May. Depending on the species and the weather conditions, some trees may start releasing their pollen even earlier. This means that individuals who are allergic to tree pollen may begin experiencing symptoms such as sneezing, itchy eyes, and a runny nose during this time.
Following the tree pollen season, grass pollen takes over as the main culprit of hay fever. From April to June, grasses such as ryegrass, timothy grass, and bluegrass release their pollen into the air. In Hillsboro, grass pollen levels can often be high to very high during this period, which can cause significant discomfort for those with grass pollen allergies.
Lastly, ragweed pollen becomes prevalent from August to November. Even though ragweed is less common in Oregon compared to some other regions, it can still trigger allergic reactions in sensitive individuals. It's also worth noting that even when overall pollen levels are low, a specific pollen could still be at high levels, potentially leading to allergy symptoms.
While the exact timing and intensity of each pollen season can vary from year to year based on factors such as weather conditions and plant growth, being aware of these general patterns can help individuals anticipate and manage their pollen allergies effectively.