Hayward, CA Pollen and Allergy Report for Summer 2023

Pollen Allergy Trends in Hayward, CA
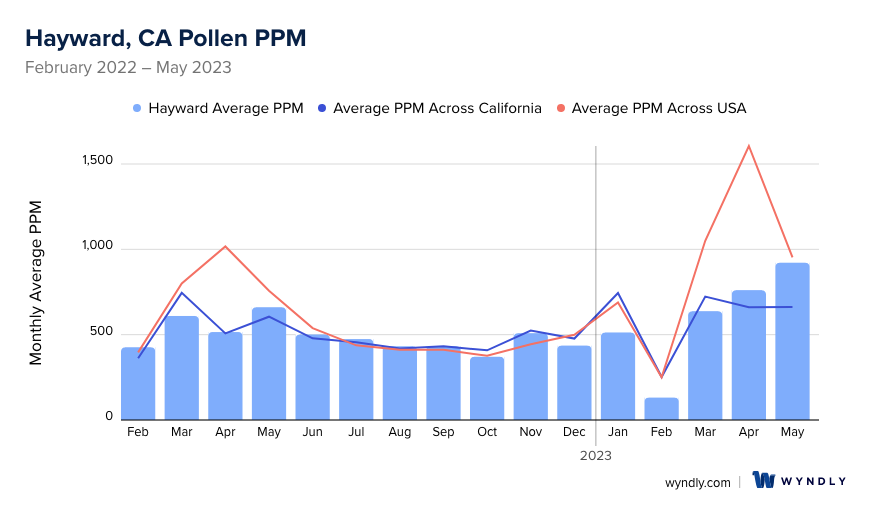
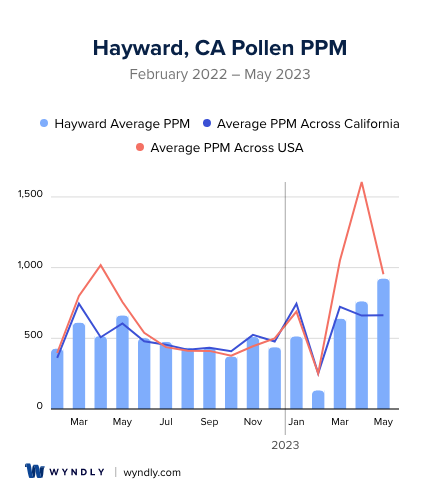
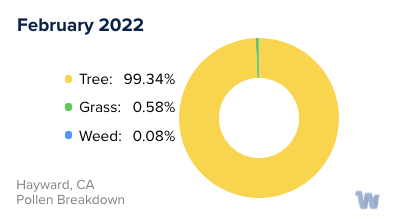
When is pollen lowest in Hayward, CA?
February
Lowest month total PPM
Avg. PPM
When is pollen highest in Hayward, CA?
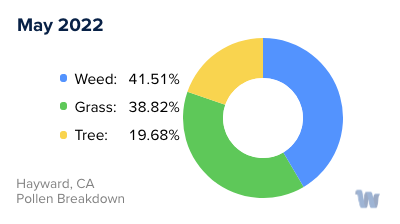
May
Highest month total PPM
Avg. PPM
How does pollen in Hayward, CA compare to California?
Hayward has a lower average PPM than the state of California.
Hayward yearly avg PPM:
California yearly avg PPM:
How does pollen in Hayward, CA compare to the USA?
Hayward has a lower average PPM than the USA.
Hayward yearly avg PPM:
USA yearly avg PPM:
Is pollen worse this year in Hayward, CA?
Spring 2023 was worse than spring 2022.
Spring 2023 PPM:
Spring 2022 PPM:
Average PPM in Hayward, CA
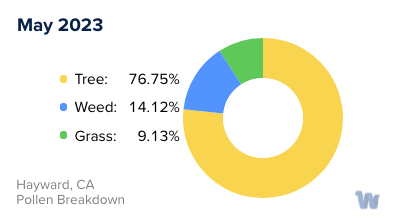
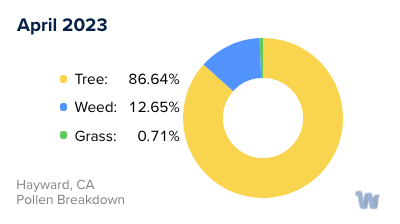
Hayward, CA Pollen and Allergy Breakdown by Month
Grass
When is grass pollen highest in Hayward, CA?
May has the highest grass pollen in Hayward, CA with an average PPM of
When is grass pollen lowest in Hayward, CA?
December has the lowest grass pollen in Hayward, CA with an average PPM of
Tree
When is tree pollen highest in Hayward, CA?
May has the highest tree pollen in Hayward, CA with an average PPM of
When is tree pollen lowest in Hayward, CA?
August has the lowest tree pollen in Hayward, CA with an average PPM of
Weed
When is weed pollen highest in Hayward, CA?
November has the highest weed pollen in Hayward, CA with an average PPM of
When is weed pollen lowest in Hayward, CA?
February has the lowest weed pollen in Hayward, CA with an average PPM of
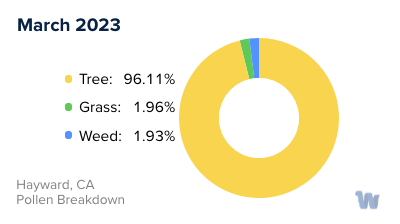
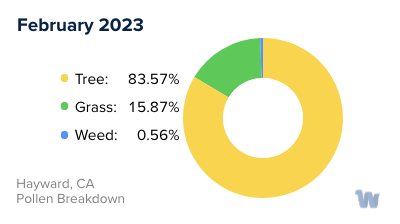
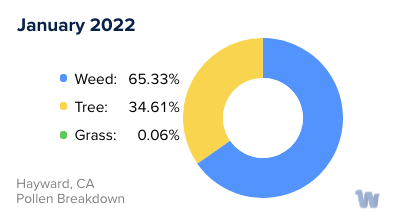
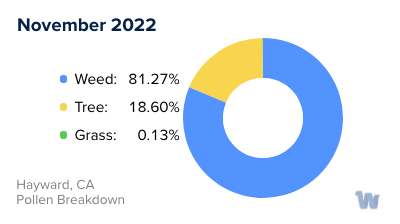
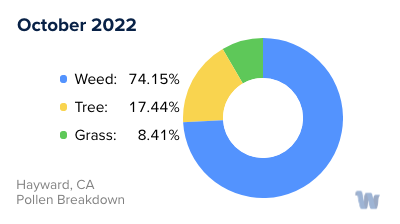
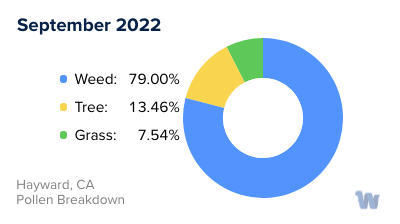
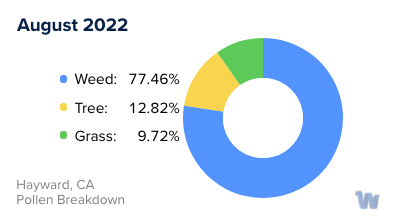
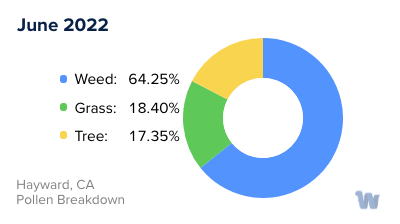
Hayward, CA Pollen Monthly Breakdown by Pollen Type


Pollen and Hay Fever in Hayward, CA
In the picturesque city of Hayward, California, the lush greenery and blooming flowers are a sight to behold. However, for some residents, this natural beauty comes with a sneeze – pollen allergies, often referred to as hay fever, can dampen the enjoyment of the outdoors.
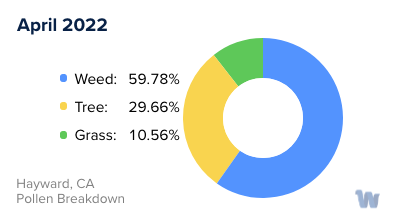
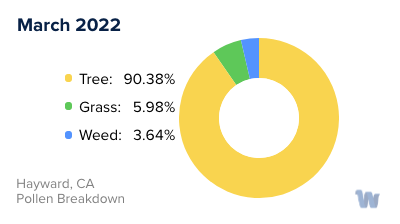
Pollen is a fine powder produced by trees, grasses, and weeds. In Hayward, the most common sources of pollen are oak, pine, and grasses such as Bermuda and ryegrass. During the spring, trees like oak and pine release copious amounts of pollen. This is often the time when individuals with sensitivities to tree pollen experience the peak of their symptoms.
As spring transitions into summer, grasses take the stage. Late spring to early summer is when grass pollen levels are at their highest. Bermuda grass and ryegrass, in particular, are prevalent in Hayward and are known for releasing pollen that can cause allergic reactions.
Weeds are another source of pollen, with their peak season being late summer to fall. Ragweed, though not as common in California as in other states, can still be found in Hayward. Those with sensitivities to weed pollen might experience symptoms during this time.
It’s important to recognize that Hayward’s Mediterranean climate, characterized by mild, wet winters and dry summers, influences the pollen seasons. The ample rainfall during the winter months helps plants thrive, leading to an abundance of pollen production in the subsequent months.
In summary, Hayward’s residents need to be mindful of tree pollen in the spring, grass pollen in late spring to early summer, and weed pollen in late summer to fall. Being aware of these pollen seasons can help individuals better understand and manage their pollen allergies, ensuring that they can fully savor the natural beauty that Hayward has to offer.