Irving, TX Pollen and Allergy Report for Summer 2023

Pollen Allergy Trends in Irving, TX

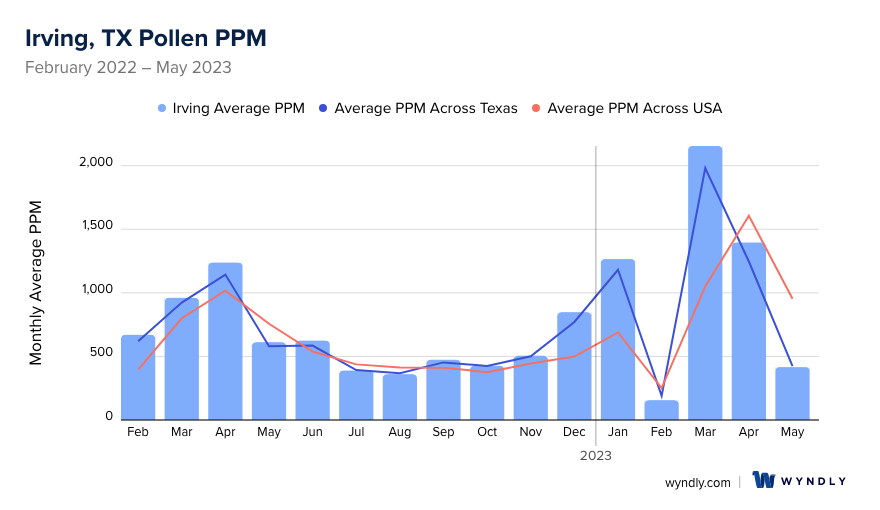
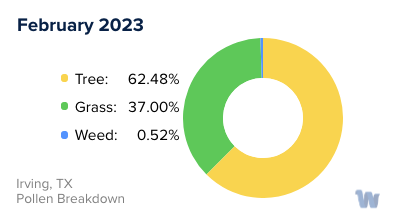
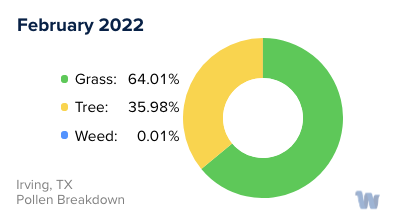
When is pollen lowest in Irving, TX?

Green down arrow

February

Lowest month total PPM

156.04 Avg. PPM

When is pollen highest in Irving, TX?

Red up arrow

March

Highest month total PPM

2,154.79 Avg. PPM

How does pollen in Irving, TX compare to Texas?

Irving has a higher average PPM than the state of Texas.

Irving yearly avg PPM: 780.99

Texas yearly avg PPM: 736.51

How does pollen in Irving, TX compare to the USA?

Irving has a higher average PPM than the USA.

Irving yearly avg PPM: 780.99

USA yearly avg PPM: 664.86

Is pollen worse this year in Irving, TX?

Spring 2023 was worse than spring 2022.

Spring 2023 PPM: 3,966.42

Spring 2022 PPM: 2,810.52

Average PPM in Irving, TX

Irving, TX Average PPM Irving, TX Average PPM

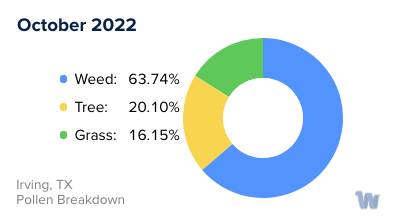
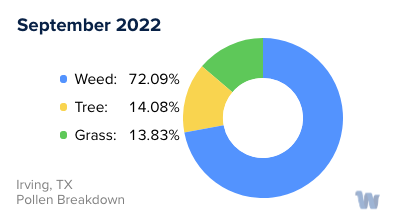
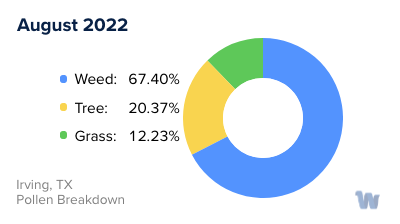
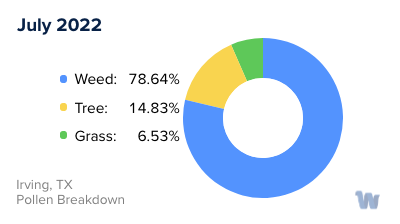
Irving, TX Pollen and Allergy Breakdown by Month

Grass

When is grass pollen highest in Irving, TX?

February has the highest grass pollen in Irving, TX with an average PPM of 428.75

When is grass pollen lowest in Irving, TX?

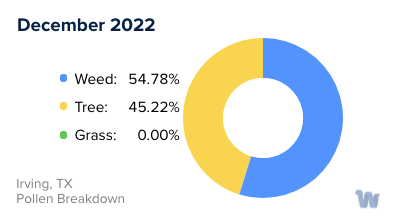
December has the lowest grass pollen in Irving, TX with an average PPM of
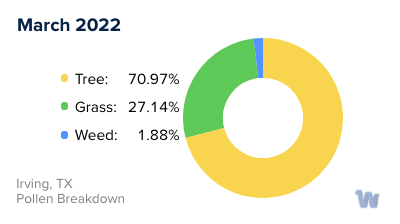
 0

Tree

When is tree pollen highest in Irving, TX?

March has the highest tree pollen in Irving, TX with an average PPM of 2,038.22

When is tree pollen lowest in Irving, TX?

July has the lowest tree pollen in Irving, TX with an average PPM of
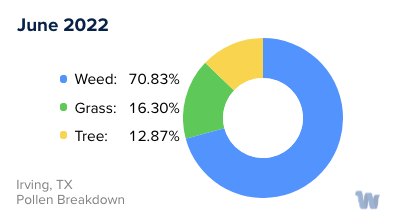
 57.62

Weed

When is weed pollen highest in Irving, TX?

December has the highest weed pollen in Irving, TX with an average PPM of 464.57

When is weed pollen lowest in Irving, TX?

February has the lowest weed pollen in Irving, TX with an average PPM of 0.07

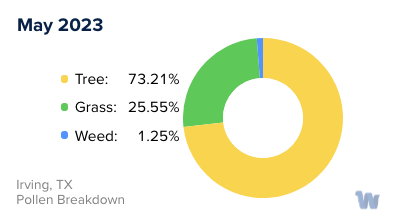
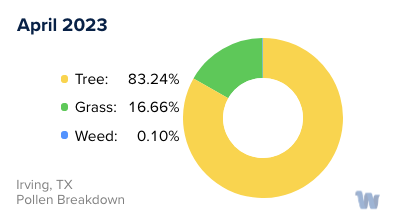
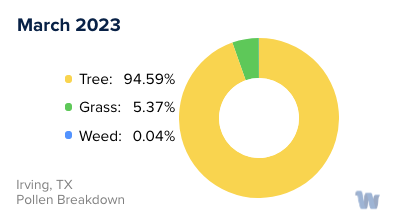
Irving, TX Pollen Monthly Breakdown by Pollen Type

Irving, TX Monthly Pollen Breakdown

Pollen and Hay Fever in Irving, TX

If you're living in Irving, Texas, or planning to spend time there, it's important to be aware of the pollen landscape. The primary producers of pollen in Texas, which can contribute to allergies, are grasses, trees, and weeds. Among these, the most common sources of allergens include Bermuda grass, Timothy grass, Sweet vernal grass, Ragweed, as well as trees like Cedar, Oak, Elm, Ash, Pecan, and Cottonwood.

Pollen allergies in Texas can flare up at different times throughout the year, depending on the specific allergen. You can experience allergy symptoms during any time of year, but they are more common in the spring, summer, and fall.

Pollen counts in Texas are typically at their peak in December, January, May, and September. During these months, if you are sensitive to pollen, you may notice your allergy symptoms intensifying. Conversely, during the evenings, the pollen counts tend to be lower, which might give some reprieve to those with pollen allergies.

It's essential to note that everyone's allergy response is individual. Some people might have a stronger reaction to certain types of pollen, while others might not be affected at all. Understanding the types of pollen prevalent in your area and the seasons during which they peak can help you better anticipate and manage your allergy symptoms, even though this discussion does not include specific treatments or remedies.

In summary, residents of Irving, Texas, need to be aware of the wide variety of pollen producers, including various types of grasses, trees, and weeds, and the varying seasons during which these allergens peak.

Irving, TX Map

What is Wyndly?

Wyndly is the easiest and most convenient way to fix your allergies forever. As an online allergy practice, Wyndly offers at-home allergy testing and treatment. The main goal of Wyndly is to retrain the immune system to stop responding to allergens, providing lasting relief from allergies.

Here's how Wyndly works:

  1. Identify Allergy Triggers: The first step is to identify the allergy triggers. You can purchase an at-home allergy test from Wyndly, or if you have already done an allergy test elsewhere, you can share your existing test results. This allows the doctors at Wyndly to pinpoint which allergies need to be treated.
  2. Get Treated by a Real Doctor: Using medications that are similar to those used in allergy shots, a doctor creates a unique sublingual immunotherapy treatment plan to desensitize your immune system. This is done using FDA-approved sublingual tablets or clinically proven dosing for oral use.
  3. Live Better Without Symptoms: The prescriptions are shipped to your door, and the doctor works with you until you’re better. Wyndly offers regular online check-ins with US-licensed physicians and 24/7 availability for questions or concerns via text, email, or call.

The treatment plans are personalized based on your specific allergy triggers and aim to treat allergies at their source, rather than just relieving symptoms for a short period. Most people report improvement in as little as one month.

Start with Wyndly today

Wyndly Summer 2023 Pollen Report Methodology

For each city, Wyndly obtained monthly pollen PPMs (pollen grains per cubic meter) for each form (tree, grass, and weed) from February 2022 - May 2023. Data were obtained from Pollen Sense, LLC Automated Particulate Sensors (APS). These sensors automatically detect particulate matter collected from ambient air, and use a neural network algorithm to identify individual pollen species and calculate daily pollen counts.

Yearly averages are calculated by summing the three allergen averages per month of data for a total monthly PPM, summing all monthly total PPMs, then dividing by 12 (month count). Used for per-city average, state average, and total USA average. Season comparisons are done by summing the months of Spring (March, April, May) for 2023 and 2022. If the absolute of the (2023-2022)/2022 is ≤ 0.05, the years were about the same. Otherwise, the more PPM, the worse the season was.

Is Wyndly right for you?

Answer just a few questions and we'll help you find out.

Get Started Today

Pollen and Allergy Reports by City