Long Beach, CA Pollen and Allergy Report for Summer 2023

Pollen Allergy Trends in Long Beach, CA
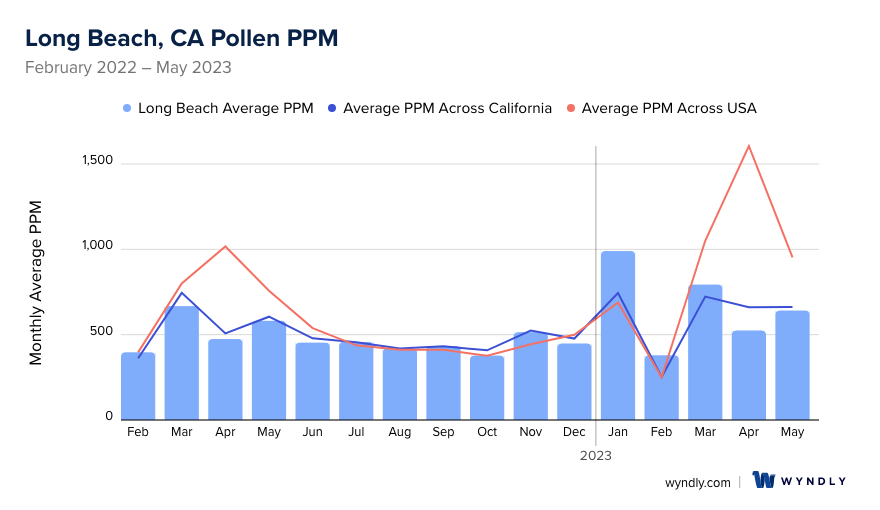
When is pollen lowest in Long Beach, CA?
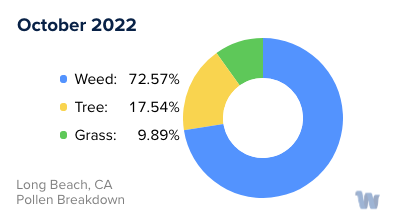
October
Lowest month total PPM
Avg. PPM
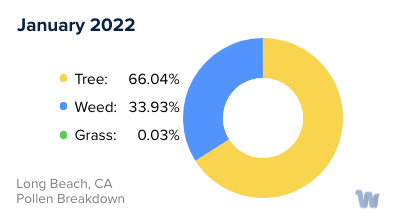
When is pollen highest in Long Beach, CA?
January
Highest month total PPM
Avg. PPM
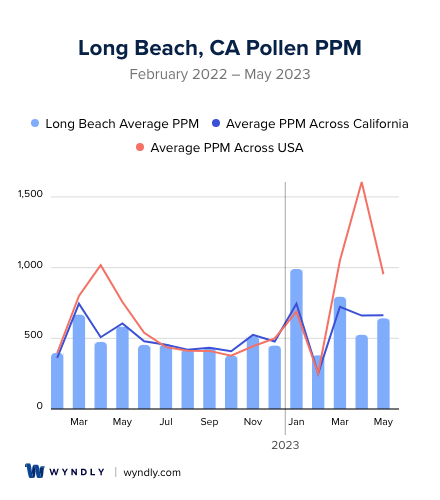
How does pollen in Long Beach, CA compare to California?
Long Beach has a higher average PPM than the state of California.
Long Beach yearly avg PPM:
California yearly avg PPM:
How does pollen in Long Beach, CA compare to the USA?
Long Beach has a lower average PPM than the USA.
Long Beach yearly avg PPM:
USA yearly avg PPM:
Is pollen worse this year in Long Beach, CA?
Spring 2023 was worse than spring 2022.
Spring 2023 PPM:
Spring 2022 PPM:
Average PPM in Long Beach, CA
Long Beach, CA Pollen and Allergy Breakdown by Month
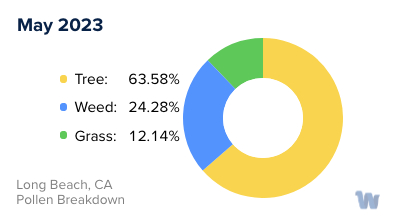
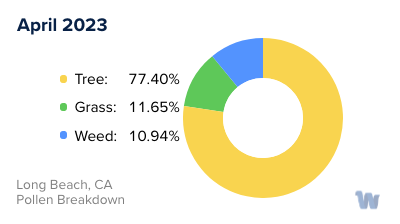
Grass
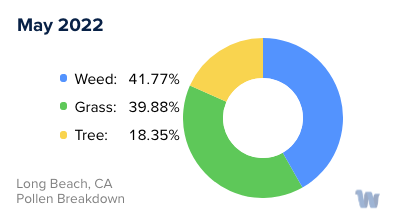
When is grass pollen highest in Long Beach, CA?
May has the highest grass pollen in Long Beach, CA with an average PPM of
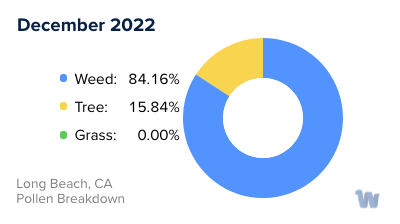
When is grass pollen lowest in Long Beach, CA?
December has the lowest grass pollen in Long Beach, CA with an average PPM of
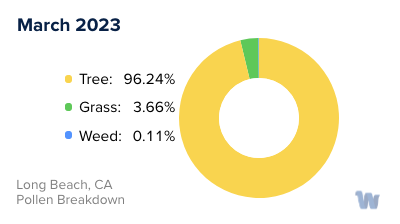
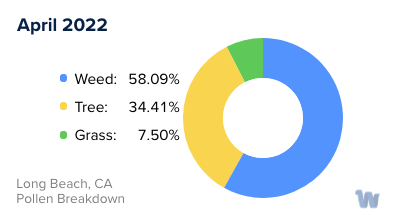
Tree
When is tree pollen highest in Long Beach, CA?
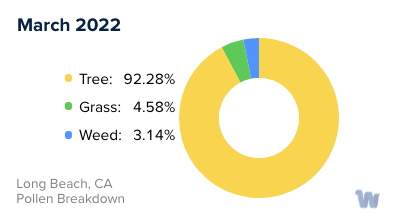
March has the highest tree pollen in Long Beach, CA with an average PPM of
When is tree pollen lowest in Long Beach, CA?
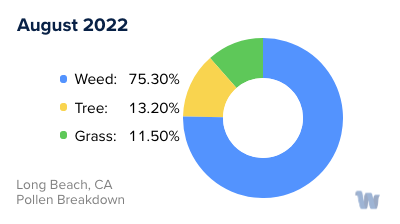
August has the lowest tree pollen in Long Beach, CA with an average PPM of
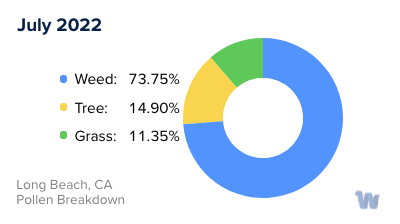
Weed
When is weed pollen highest in Long Beach, CA?
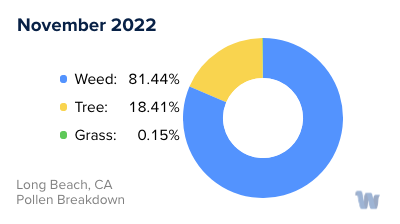
November has the highest weed pollen in Long Beach, CA with an average PPM of
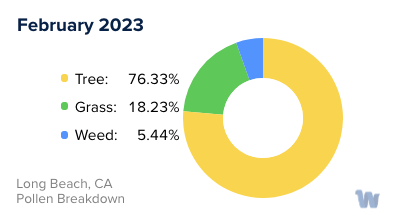
When is weed pollen lowest in Long Beach, CA?
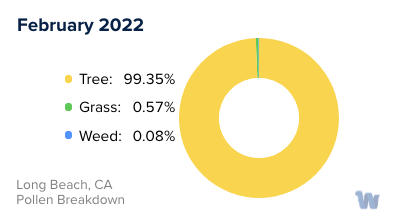
February has the lowest weed pollen in Long Beach, CA with an average PPM of
Long Beach, CA Pollen Monthly Breakdown by Pollen Type
Pollen and Hay Fever in Long Beach, CA
As residents of Long Beach, California, many of us are all too familiar with the sniffling, sneezing, and watery eyes that signal the arrival of pollen season. These symptoms, collectively known as hay fever or pollen allergies, can be a regular part of life in our vibrant coastal city.
Pollen allergies in Long Beach are often triggered by a variety of sources, given our city's diverse flora. The primary offenders typically include trees, grasses, and weeds, each of which have their own unique pollen release schedules.
Tree pollen is generally the first to arrive on the scene. As winter transitions into spring, typically from February to May, trees such as oak, pine, and cedar begin to release their pollen into the air. Our city's many palm trees also contribute to this pollen mix, despite their seemingly harmless nature.
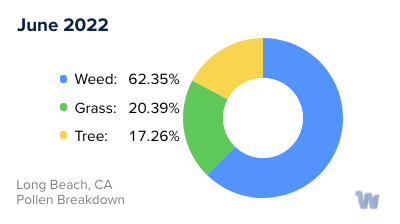
Following the tree pollen season, we enter grass pollen season. Grasses such as Bermuda grass, ryegrass, and fescue are common throughout Long Beach and begin their pollen release from late spring to early summer, generally peaking in May and June.
Finally, as summer transitions into fall, we witness the rise of weed pollen. This includes plants like ragweed, sagebrush, and nettle. These plants are prolific pollen producers and can cause significant allergy symptoms in many individuals.
It's important to remember that these timelines are general guidelines and actual pollen counts can vary from year to year based on factors like rainfall, temperature, and wind patterns. Additionally, because of our city's coastal location, sea breezes can sometimes help to clear the air of pollen, providing temporary relief.
Understanding the types of pollen and their seasons is the first step in managing pollen allergies. By being aware of the pollen schedule in Long Beach, residents can better anticipate and prepare for the challenges of each pollen season. While pollen allergies can be inconvenient, they are a small price to pay for living in our beautiful, biodiverse city.