Lubbock, TX Pollen and Allergy Report for Summer 2023

Pollen Allergy Trends in Lubbock, TX

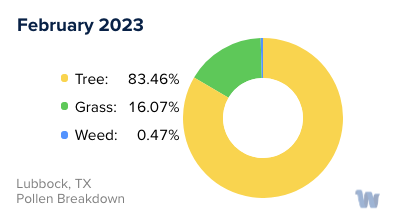
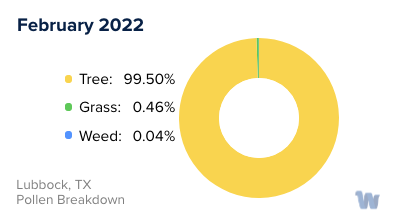
When is pollen lowest in Lubbock, TX?

Green down arrow

February

Lowest month total PPM

155.03 Avg. PPM

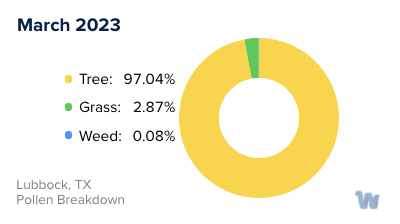
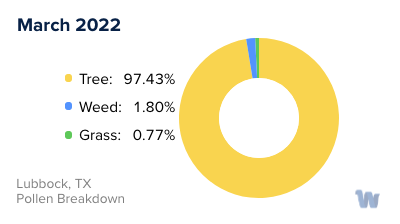
When is pollen highest in Lubbock, TX?

Red up arrow

March

Highest month total PPM

1,053.83 Avg. PPM

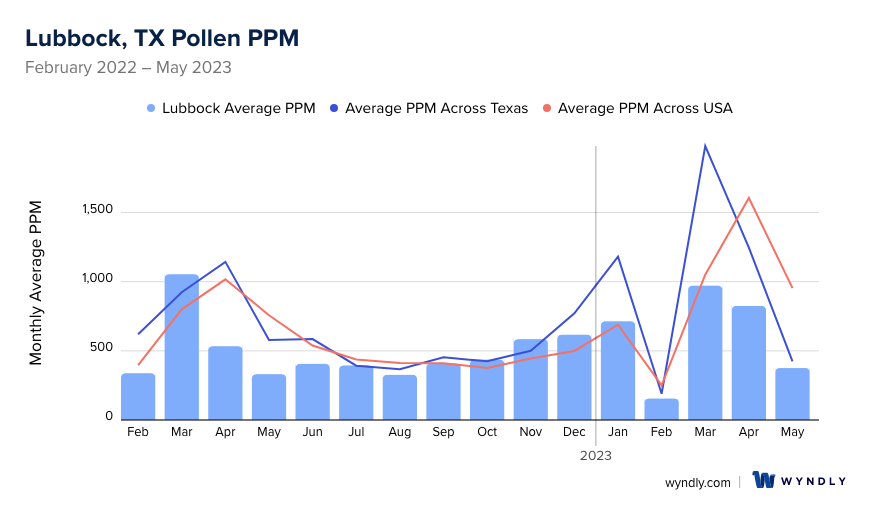
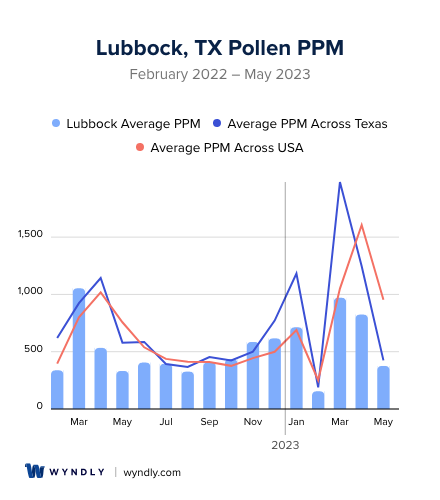
How does pollen in Lubbock, TX compare to Texas?

Lubbock has a lower average PPM than the state of Texas.

Lubbock yearly avg PPM: 529.32

Texas yearly avg PPM: 736.51

How does pollen in Lubbock, TX compare to the USA?

Lubbock has a lower average PPM than the USA.

Lubbock yearly avg PPM: 529.32

USA yearly avg PPM: 664.86

Is pollen worse this year in Lubbock, TX?

Spring 2023 was worse than spring 2022.

Spring 2023 PPM: 2,171.22

Spring 2022 PPM: 1,918.7

Average PPM in Lubbock, TX

Lubbock, TX Average PPM Lubbock, TX Average PPM

Lubbock, TX Pollen and Allergy Breakdown by Month
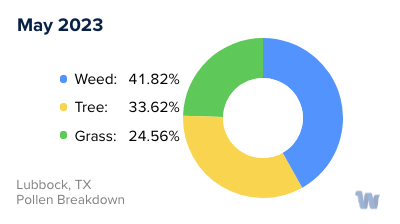
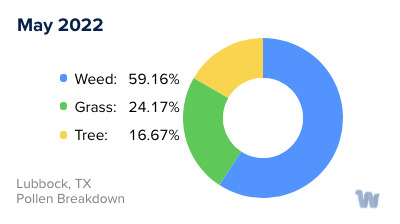
Grass

When is grass pollen highest in Lubbock, TX?

May has the highest grass pollen in Lubbock, TX with an average PPM of 92.23

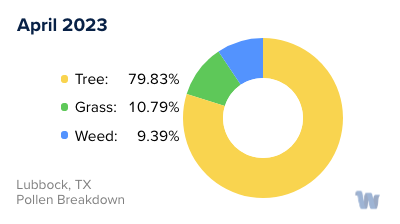
When is grass pollen lowest in Lubbock, TX?

April has the lowest grass pollen in Lubbock, TX with an average PPM of
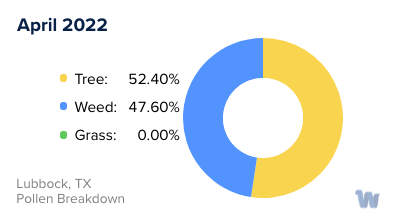
 0

Tree

When is tree pollen highest in Lubbock, TX?

March has the highest tree pollen in Lubbock, TX with an average PPM of 1,026.79

When is tree pollen lowest in Lubbock, TX?

May has the lowest tree pollen in Lubbock, TX with an average PPM of
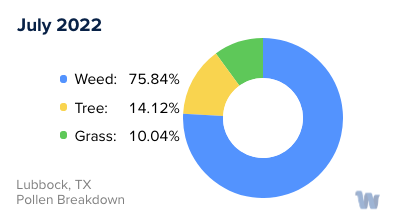
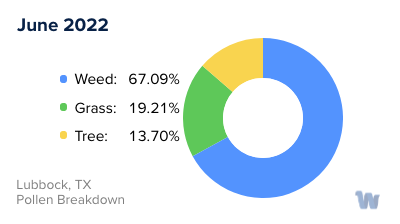
 55.25

Weed

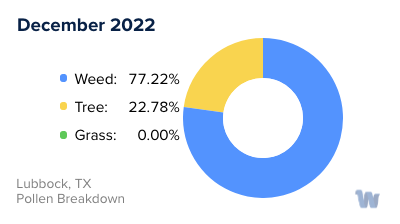
When is weed pollen highest in Lubbock, TX?

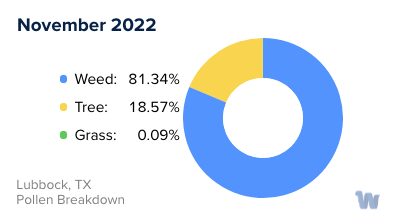
December has the highest weed pollen in Lubbock, TX with an average PPM of 476.03

When is weed pollen lowest in Lubbock, TX?

February has the lowest weed pollen in Lubbock, TX with an average PPM of 0.13

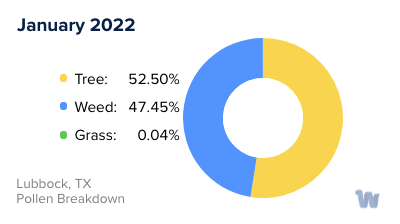
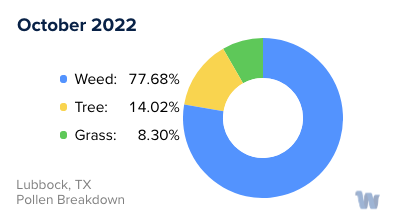
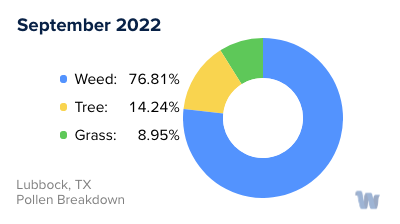
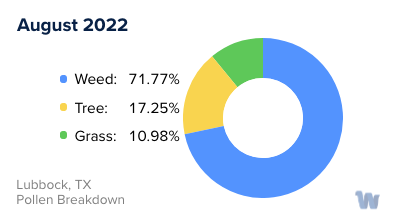
Lubbock, TX Pollen Monthly Breakdown by Pollen Type

Lubbock, TX Monthly Pollen Breakdown

Pollen and Hay Fever in Lubbock, TX

In Lubbock, Texas, residents are no strangers to pollen allergies, also known as hay fever. A variety of pollen sources can contribute to allergy symptoms in the area, primarily stemming from local trees, weeds, and grasses.

Tree pollen, in particular, can be a significant culprit for those with hay fever. Specific tree species and the severity of their pollen production can fluctuate daily, dependent on weather conditions and the time of year. However, trees are not the sole culprits. Weeds and grasses also play a substantial role in pollen production, contributing to the overall pollen count that affects allergy sufferers in Lubbock.

The transition of seasons also brings a shift in the types of pollen predominantly present in the air. As summer gives way to fall, the primary allergy triggers transition from grasses to weeds. In particular, weeds like pigweed and ragweed become the major contributors to fall allergies in Lubbock, growing in abundance even in areas such as bar ditches.

Understanding the types of pollen present in the environment and their seasonal variations can help Lubbock residents better anticipate and manage their allergy symptoms. While the severity and timing of these pollen seasons can vary year by year due to weather and other environmental factors, the recurring patterns provide valuable insights into what triggers might be causing discomfort and when those triggers are most likely to be present.

Remember, pollen levels and types can vary significantly from day to day and season to season. Staying informed about these changes can help those with pollen allergies in Lubbock better understand their symptoms and take proactive steps to manage their wellbeing.

Lubbock, TX Map

What is Wyndly?

Wyndly is the easiest and most convenient way to fix your allergies forever. As an online allergy practice, Wyndly offers at-home allergy testing and treatment. The main goal of Wyndly is to retrain the immune system to stop responding to allergens, providing lasting relief from allergies.

Here's how Wyndly works:

  1. Identify Allergy Triggers: The first step is to identify the allergy triggers. You can purchase an at-home allergy test from Wyndly, or if you have already done an allergy test elsewhere, you can share your existing test results. This allows the doctors at Wyndly to pinpoint which allergies need to be treated.
  2. Get Treated by a Real Doctor: Using medications that are similar to those used in allergy shots, a doctor creates a unique sublingual immunotherapy treatment plan to desensitize your immune system. This is done using FDA-approved sublingual tablets or clinically proven dosing for oral use.
  3. Live Better Without Symptoms: The prescriptions are shipped to your door, and the doctor works with you until you’re better. Wyndly offers regular online check-ins with US-licensed physicians and 24/7 availability for questions or concerns via text, email, or call.

The treatment plans are personalized based on your specific allergy triggers and aim to treat allergies at their source, rather than just relieving symptoms for a short period. Most people report improvement in as little as one month.

Start with Wyndly today

Wyndly Summer 2023 Pollen Report Methodology

For each city, Wyndly obtained monthly pollen PPMs (pollen grains per cubic meter) for each form (tree, grass, and weed) from February 2022 - May 2023. Data were obtained from Pollen Sense, LLC Automated Particulate Sensors (APS). These sensors automatically detect particulate matter collected from ambient air, and use a neural network algorithm to identify individual pollen species and calculate daily pollen counts.

Yearly averages are calculated by summing the three allergen averages per month of data for a total monthly PPM, summing all monthly total PPMs, then dividing by 12 (month count). Used for per-city average, state average, and total USA average. Season comparisons are done by summing the months of Spring (March, April, May) for 2023 and 2022. If the absolute of the (2023-2022)/2022 is ≤ 0.05, the years were about the same. Otherwise, the more PPM, the worse the season was.

Is Wyndly right for you?

Answer just a few questions and we'll help you find out.

Get Started Today

Pollen and Allergy Reports by City