Cape Coral, FL Pollen and Allergy Report for Summer 2023

Pollen Allergy Trends in Cape Coral, FL
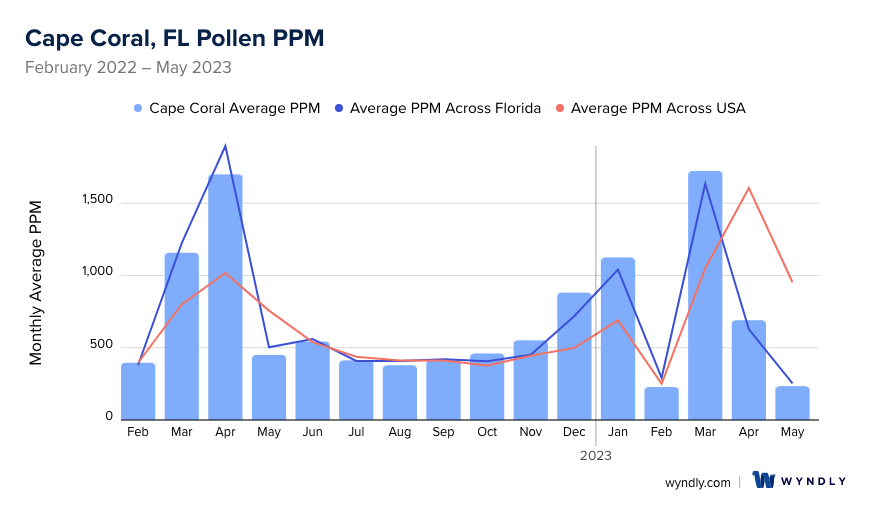
When is pollen lowest in Cape Coral, FL?
February
Lowest month total PPM
Avg. PPM
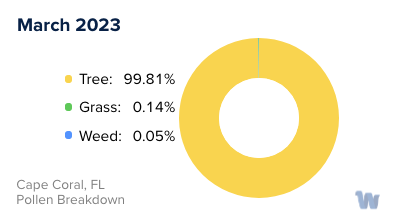
When is pollen highest in Cape Coral, FL?
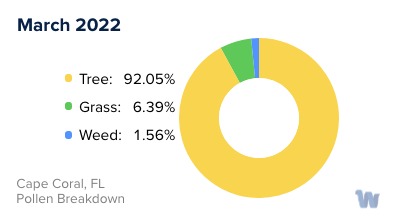
March
Highest month total PPM
Avg. PPM
How does pollen in Cape Coral, FL compare to Florida?
Cape Coral has a higher average PPM than the state of Florida.
Cape Coral yearly avg PPM:
Florida yearly avg PPM:
How does pollen in Cape Coral, FL compare to the USA?
Cape Coral has a higher average PPM than the USA.
Cape Coral yearly avg PPM:
USA yearly avg PPM:
Is pollen worse this year in Cape Coral, FL?
Spring 2023 was better than spring 2022.
Spring 2023 PPM:
Spring 2022 PPM:
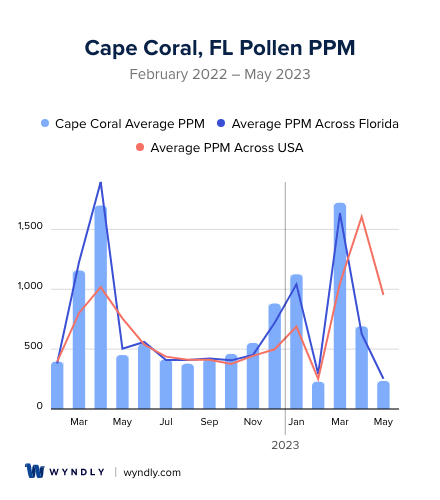
Average PPM in Cape Coral, FL
Cape Coral, FL Pollen and Allergy Breakdown by Month
Grass
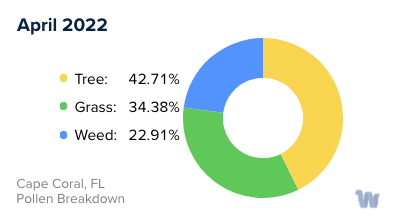
When is grass pollen highest in Cape Coral, FL?
April has the highest grass pollen in Cape Coral, FL with an average PPM of
When is grass pollen lowest in Cape Coral, FL?
December has the lowest grass pollen in Cape Coral, FL with an average PPM of
Tree
When is tree pollen highest in Cape Coral, FL?
March has the highest tree pollen in Cape Coral, FL with an average PPM of
When is tree pollen lowest in Cape Coral, FL?
July has the lowest tree pollen in Cape Coral, FL with an average PPM of
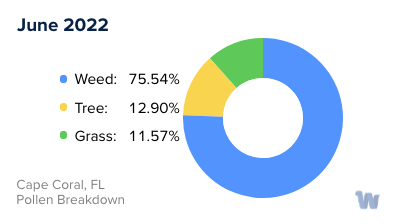
Weed
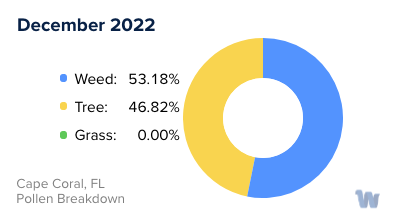
When is weed pollen highest in Cape Coral, FL?
December has the highest weed pollen in Cape Coral, FL with an average PPM of
When is weed pollen lowest in Cape Coral, FL?
February has the lowest weed pollen in Cape Coral, FL with an average PPM of
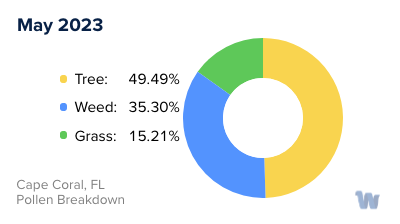
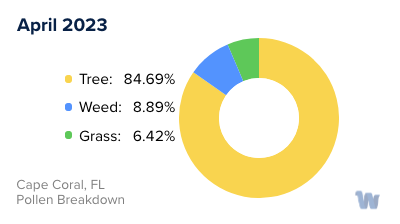
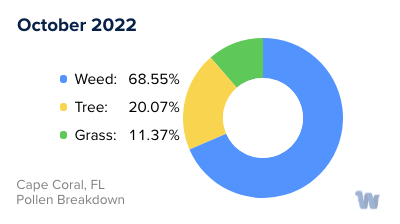
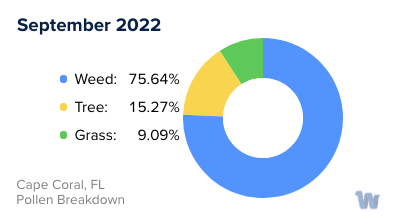
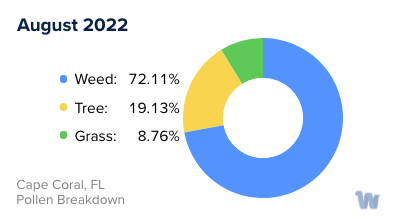
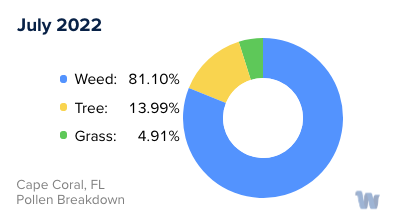
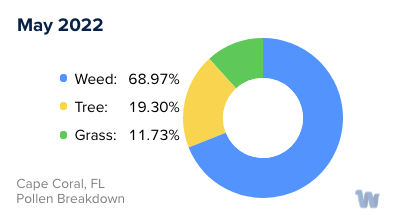
Cape Coral, FL Pollen Monthly Breakdown by Pollen Type


Pollen and Hay Fever in Cape Coral, FL
In Cape Coral, Florida, pollen allergies and hay fever are a common concern for many residents. These conditions are typically triggered by the pollens of various plants present in the region, which are released into the air at different times of the year.
Among the most prevalent types of pollen in Cape Coral are tree, grass, and ragweed pollen. Tree pollen is a significant trigger for those with pollen allergies. The most common tree pollens in the area come from oak, juniper, and bayberry trees.
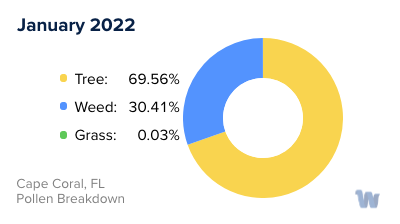
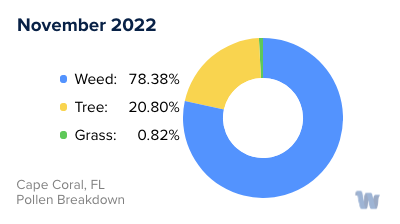
The timing of pollen release, often referred to as "pollen seasons," varies depending on the type of plant. Tree pollen, for instance, is usually most prevalent from January to April, and then again in November. This pattern means that there are essentially two tree pollen seasons in Cape Coral. Over recent years, the levels of tree pollen have been increasing, particularly during the early part of the year, from January to April.
Grass pollen, another common allergen, tends to peak later in the year, specifically in the late summer. Those who find themselves sneezing and dealing with a runny nose during this time might be reacting to grass pollen in the air.
Ragweed pollen, on the other hand, typically becomes a concern in the fall. Ragweed plants are common across many parts of the U.S.
and their pollen can be a potent allergen.
In Cape Coral, there is typically a one- to two-month respite from high pollen levels during the winter months before the cycle of tree pollen release begins again.
In summary, the types of pollen present and their seasonal variations play a significant role in triggering pollen allergies and hay fever in Cape Coral. The specific timing of these pollen seasons, along with the types of plants contributing to the pollen count, can help individuals better anticipate and understand their seasonal allergy symptoms.