Corona, CA Pollen and Allergy Report for Summer 2023

Pollen Allergy Trends in Corona, CA

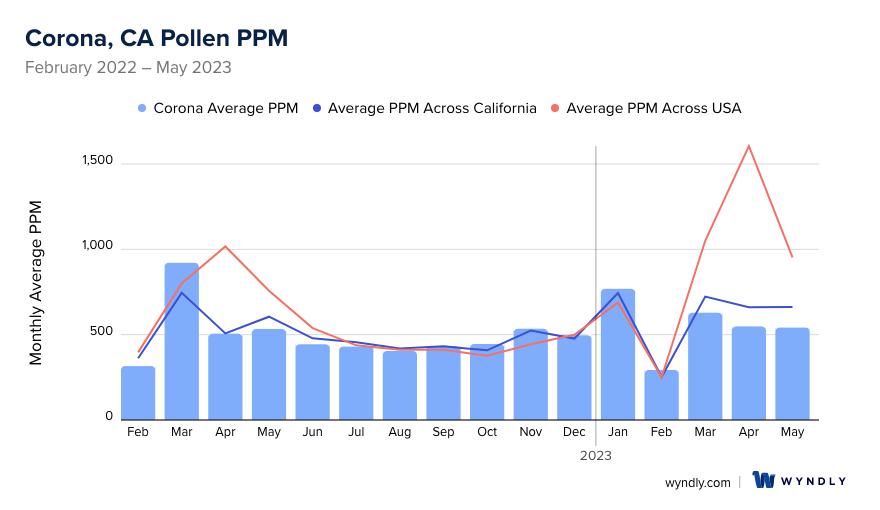
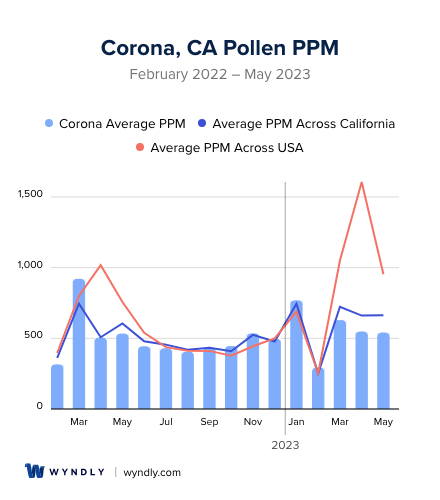
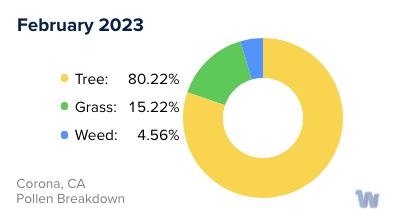
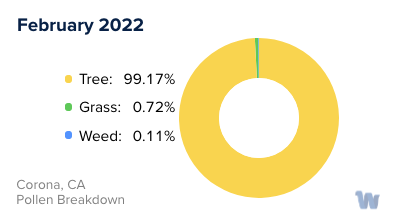
When is pollen lowest in Corona, CA?

Green down arrow

February

Lowest month total PPM

293.32 Avg. PPM

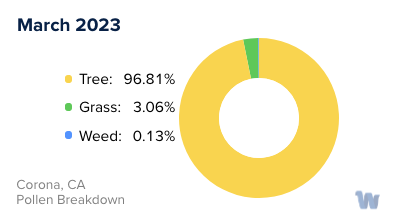
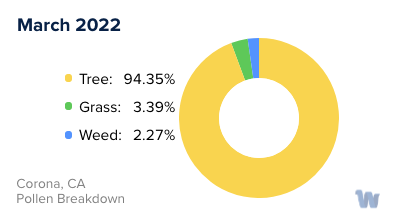
When is pollen highest in Corona, CA?

Red up arrow

March

Highest month total PPM

921.15 Avg. PPM

How does pollen in Corona, CA compare to California?

Corona has a lower average PPM than the state of California.

Corona yearly avg PPM: 515.29

California yearly avg PPM: 528.52

How does pollen in Corona, CA compare to the USA?

Corona has a lower average PPM than the USA.

Corona yearly avg PPM: 515.29

USA yearly avg PPM: 664.86

Is pollen worse this year in Corona, CA?

Spring 2023 was better than spring 2022.

Spring 2023 PPM: 1,718.68

Spring 2022 PPM: 1,960.74

Average PPM in Corona, CA

Corona, CA Average PPM Corona, CA Average PPM

Corona, CA Pollen and Allergy Breakdown by Month
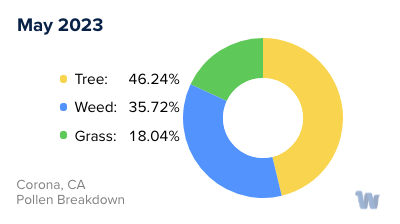
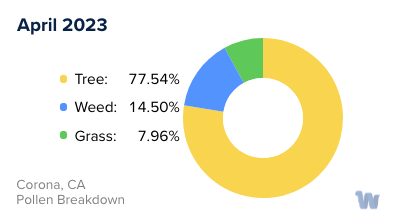
Grass

When is grass pollen highest in Corona, CA?

May has the highest grass pollen in Corona, CA with an average PPM of 218.87

When is grass pollen lowest in Corona, CA?

December has the lowest grass pollen in Corona, CA with an average PPM of 0

Tree

When is tree pollen highest in Corona, CA?

March has the highest tree pollen in Corona, CA with an average PPM of 869.07

When is tree pollen lowest in Corona, CA?

August has the lowest tree pollen in Corona, CA with an average PPM of
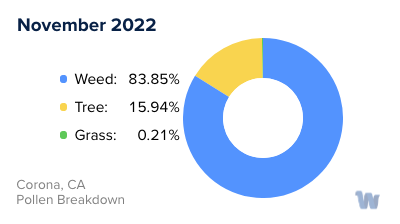
 56.38

Weed

When is weed pollen highest in Corona, CA?

November has the highest weed pollen in Corona, CA with an average PPM of 448.51

When is weed pollen lowest in Corona, CA?

February has the lowest weed pollen in Corona, CA with an average PPM of 0.34

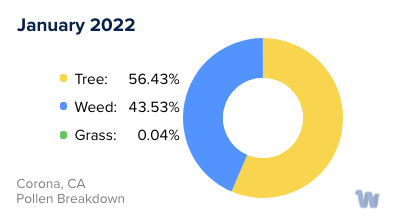
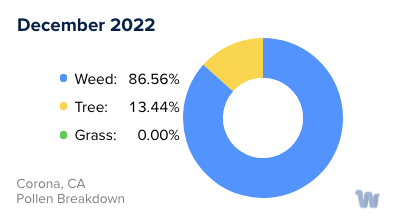
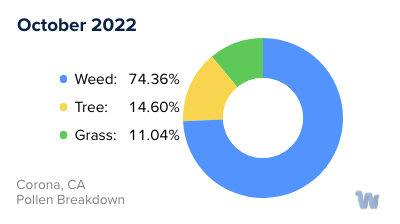
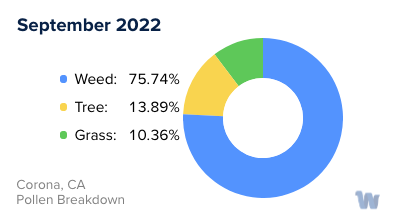
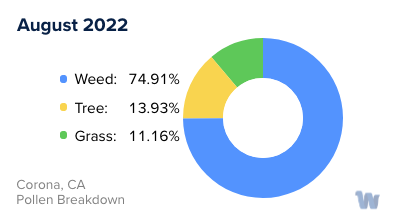
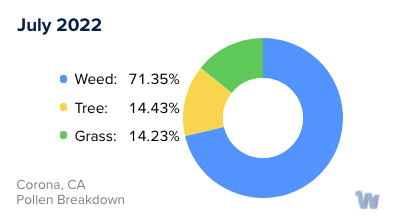
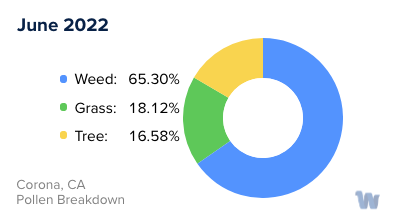
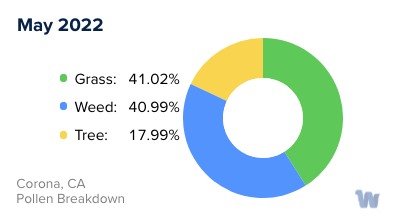
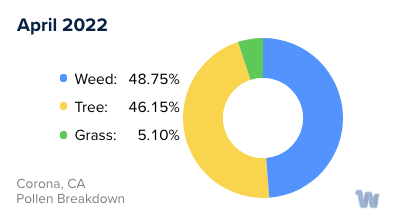
Corona, CA Pollen Monthly Breakdown by Pollen Type

Corona, CA Monthly Pollen Breakdown

Pollen and Hay Fever in Corona, CA

In Corona, California, people often experience pollen allergies, commonly known as hay fever, due to various types of pollens present in different seasons. The local climate and vegetation significantly influence the types of pollens and their peak times.

During the spring season, the most prevalent allergens come from trees. In Southern California, including Corona, the most common tree pollens include ash, olive, oak, sycamore, walnut, eucalyptus, and mulberry. In addition to these, cypress, willow, and juniper tree pollens are also quite common in nearby regions such as San Bernardino and Riverside, which could impact Corona residents as well.

As we move into the summer season, the primary culprits shift from trees to grasses. Southern Californians often contend with oat and Bermuda grasses, ryegrass, and bluegrass. Moreover, other types of grasses such as bent, timothy, orchard, and fescue are also present in surrounding areas, contributing to the overall pollen load.

When fall arrives, weeds become the dominant allergens. Sagebrush, Russian thistle, and pigweed are the biggest offenders in Southern California. In addition to these, the Corona area also sees allergens from ragweed, saltbush, and amaranth.

Winter usually provides some respite from seasonal allergies due to a decrease in outdoor pollens. However, indoor allergens can still be an issue during these cooler months.

Understanding the types of pollens present in each season in Corona, California, can help residents anticipate and recognize their allergy symptoms. While this information doesn't provide solutions or treatments, it does offer a roadmap for navigating the shifting landscape of pollen allergies throughout the year.

Corona, CA Map

What is Wyndly?

Wyndly is the easiest and most convenient way to fix your allergies forever. As an online allergy practice, Wyndly offers at-home allergy testing and treatment. The main goal of Wyndly is to retrain the immune system to stop responding to allergens, providing lasting relief from allergies.

Here's how Wyndly works:

  1. Identify Allergy Triggers: The first step is to identify the allergy triggers. You can purchase an at-home allergy test from Wyndly, or if you have already done an allergy test elsewhere, you can share your existing test results. This allows the doctors at Wyndly to pinpoint which allergies need to be treated.
  2. Get Treated by a Real Doctor: Using medications that are similar to those used in allergy shots, a doctor creates a unique sublingual immunotherapy treatment plan to desensitize your immune system. This is done using FDA-approved sublingual tablets or clinically proven dosing for oral use.
  3. Live Better Without Symptoms: The prescriptions are shipped to your door, and the doctor works with you until you’re better. Wyndly offers regular online check-ins with US-licensed physicians and 24/7 availability for questions or concerns via text, email, or call.

The treatment plans are personalized based on your specific allergy triggers and aim to treat allergies at their source, rather than just relieving symptoms for a short period. Most people report improvement in as little as one month.

Start with Wyndly today

Wyndly Summer 2023 Pollen Report Methodology

For each city, Wyndly obtained monthly pollen PPMs (pollen grains per cubic meter) for each form (tree, grass, and weed) from February 2022 - May 2023. Data were obtained from Pollen Sense, LLC Automated Particulate Sensors (APS). These sensors automatically detect particulate matter collected from ambient air, and use a neural network algorithm to identify individual pollen species and calculate daily pollen counts.

Yearly averages are calculated by summing the three allergen averages per month of data for a total monthly PPM, summing all monthly total PPMs, then dividing by 12 (month count). Used for per-city average, state average, and total USA average. Season comparisons are done by summing the months of Spring (March, April, May) for 2023 and 2022. If the absolute of the (2023-2022)/2022 is ≤ 0.05, the years were about the same. Otherwise, the more PPM, the worse the season was.

Is Wyndly right for you?

Answer just a few questions and we'll help you find out.

Get Started Today

Pollen and Allergy Reports by City