Fremont, CA Pollen and Allergy Report for Summer 2023

Pollen Allergy Trends in Fremont, CA
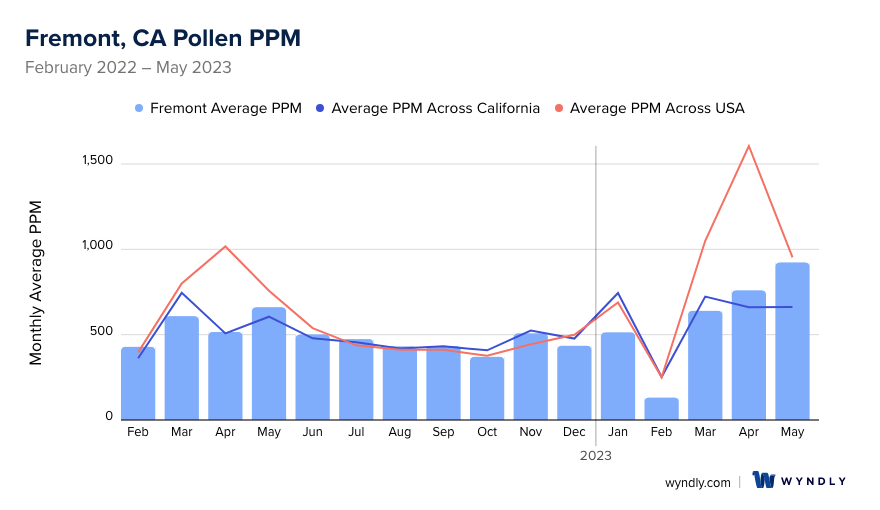
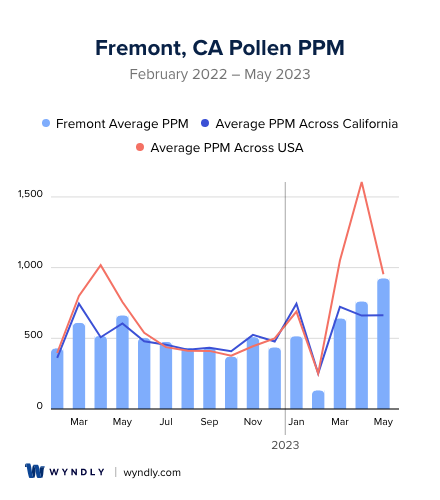
When is pollen lowest in Fremont, CA?
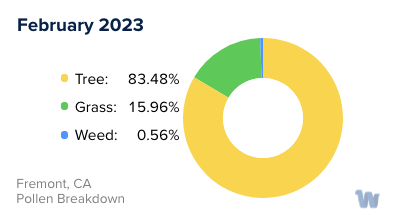
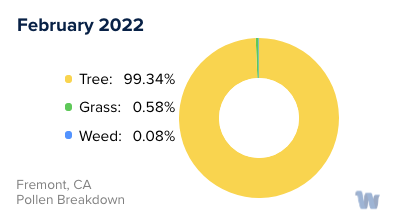
February
Lowest month total PPM
Avg. PPM
When is pollen highest in Fremont, CA?
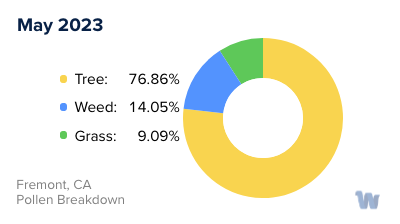
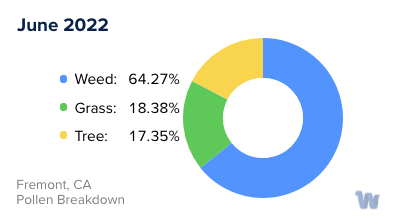
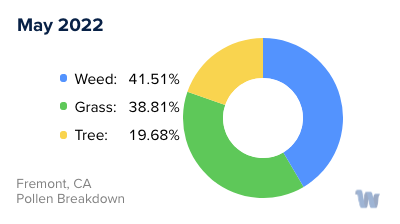
May
Highest month total PPM
Avg. PPM
How does pollen in Fremont, CA compare to California?
Fremont has a lower average PPM than the state of California.
Fremont yearly avg PPM:
California yearly avg PPM:
How does pollen in Fremont, CA compare to the USA?
Fremont has a lower average PPM than the USA.
Fremont yearly avg PPM:
USA yearly avg PPM:
Is pollen worse this year in Fremont, CA?
Spring 2023 was worse than spring 2022.
Spring 2023 PPM:
Spring 2022 PPM:
Average PPM in Fremont, CA
Fremont, CA Pollen and Allergy Breakdown by Month
Grass
When is grass pollen highest in Fremont, CA?
May has the highest grass pollen in Fremont, CA with an average PPM of
When is grass pollen lowest in Fremont, CA?
December has the lowest grass pollen in Fremont, CA with an average PPM of
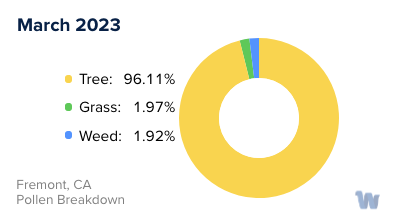
Tree
When is tree pollen highest in Fremont, CA?
May has the highest tree pollen in Fremont, CA with an average PPM of
When is tree pollen lowest in Fremont, CA?
August has the lowest tree pollen in Fremont, CA with an average PPM of
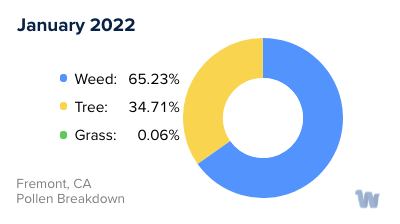
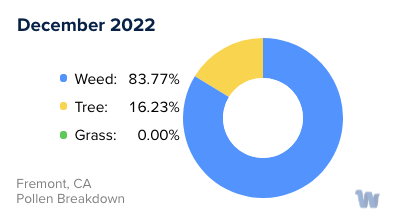
Weed
When is weed pollen highest in Fremont, CA?
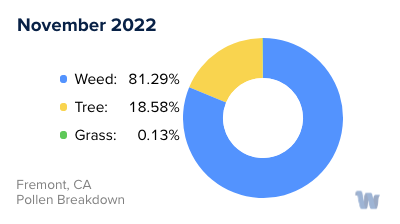
November has the highest weed pollen in Fremont, CA with an average PPM of
When is weed pollen lowest in Fremont, CA?
February has the lowest weed pollen in Fremont, CA with an average PPM of
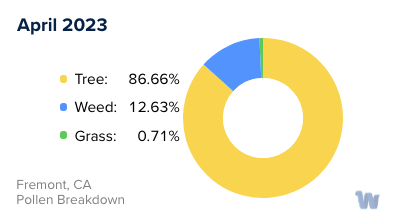
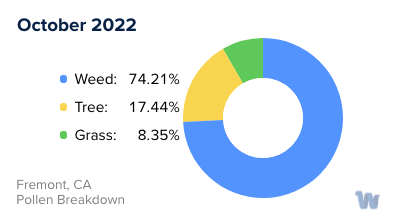
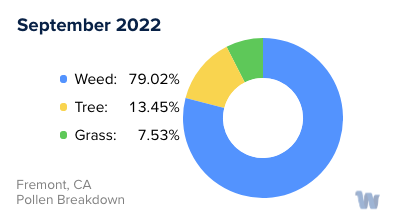
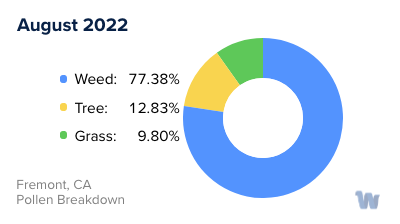
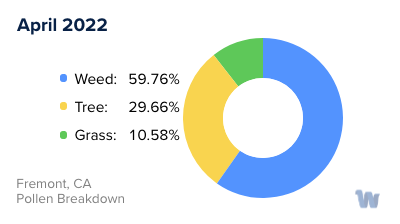
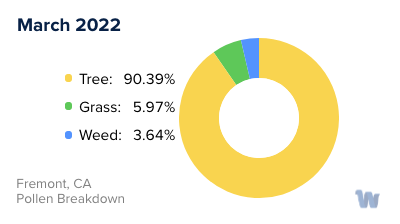
Fremont, CA Pollen Monthly Breakdown by Pollen Type

Pollen and Hay Fever in Fremont, CA
Pollen allergies, colloquially referred to as "hay fever," are a prevalent health concern among residents of Fremont, California. The Golden State's mild climate and diverse plant life contribute to prolonged pollen seasons, leading to a surge in allergies for susceptible individuals.
Fremont's pollen scenario is heavily influenced by three primary types: tree, grass, and weed pollen. Each varies in their peak seasons and the degree to which they trigger allergic reactions.
Tree pollen is typically the first to arrive as winter gives way to spring. The predominant trees in Fremont that contribute to this pollen type include oak, cedar, and pine. Residents may notice increased allergy symptoms starting as early as February, with tree pollen levels peaking around April.
Following closely behind tree pollen season is the grass pollen season. This usually starts in late spring and can last through early summer. The most common grasses in Fremont contributing to the pollen count are Bermuda grass, Kentucky bluegrass, and ryegrass. These grasses release their pollen into the air, causing an uptick in hay fever symptoms from May through July.
Lastly, weed pollen makes its appearance in late summer and continues through fall. This is often the culprit behind those lingering hay fever symptoms experienced in August through October. Ragweed is the primary weed contributing to this pollen type, along with sagebrush and nettle.
What makes Fremont unique is its geographical location. Nestled in the San Francisco Bay Area, the city experiences a mix of coastal and inland climates, affecting the duration and intensity of pollen seasons. The wind patterns can carry pollen over large distances, potentially increasing exposure even when specific plants are not in the immediate vicinity.
Understanding the types of pollen and their respective seasons in Fremont, California, can be the first step in navigating life with pollen allergies or hay fever. Awareness of peak pollen times can help residents better anticipate and manage their allergy symptoms, despite the lack of immediate remedies or treatments.