Chicago, IL Pollen and Allergy Report for Summer 2023

Pollen Allergy Trends in Chicago, IL
When is pollen lowest in Chicago, IL?
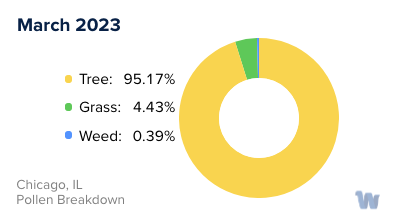
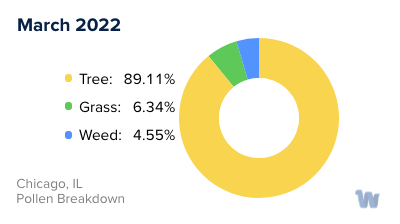
March
Lowest month total PPM
Avg. PPM
When is pollen highest in Chicago, IL?
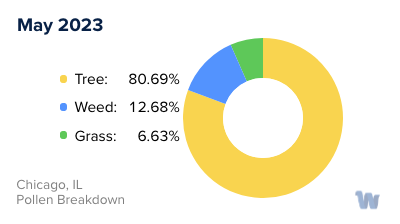
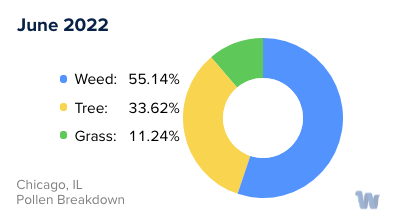
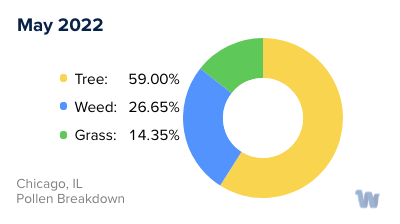
May
Highest month total PPM
Avg. PPM
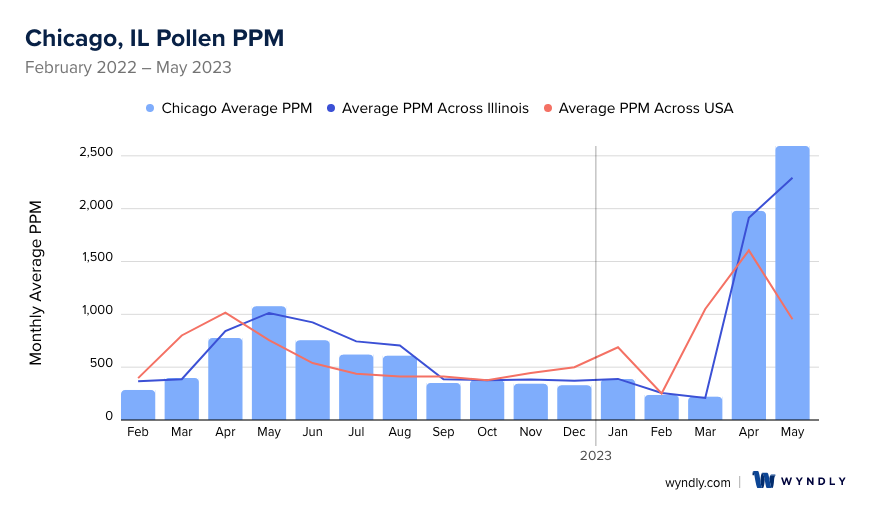
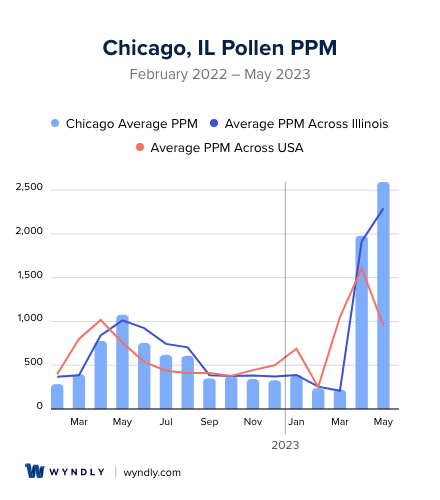
How does pollen in Chicago, IL compare to Illinois?
Chicago has a lower average PPM than the state of Illinois.
Chicago yearly avg PPM:
Illinois yearly avg PPM:
How does pollen in Chicago, IL compare to the USA?
Chicago has a higher average PPM than the USA.
Chicago yearly avg PPM:
USA yearly avg PPM:
Is pollen worse this year in Chicago, IL?
Spring 2023 was worse than spring 2022.
Spring 2023 PPM:
Spring 2022 PPM:
Average PPM in Chicago, IL
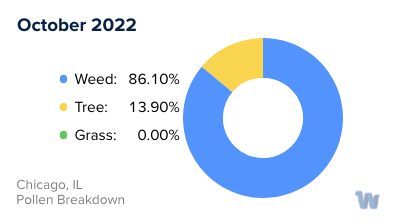
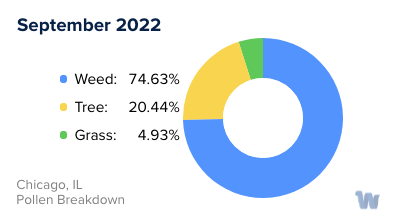
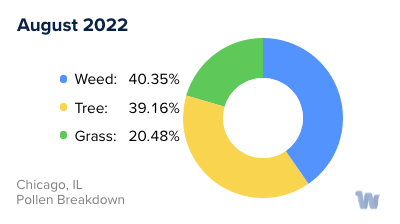
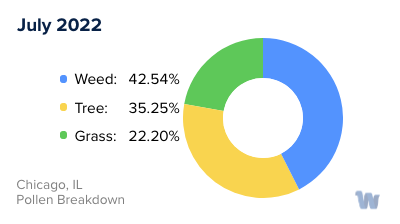
Chicago, IL Pollen and Allergy Breakdown by Month
Grass
When is grass pollen highest in Chicago, IL?
May has the highest grass pollen in Chicago, IL with an average PPM of
When is grass pollen lowest in Chicago, IL?
October has the lowest grass pollen in Chicago, IL with an average PPM of
Tree
When is tree pollen highest in Chicago, IL?
May has the highest tree pollen in Chicago, IL with an average PPM of
When is tree pollen lowest in Chicago, IL?
October has the lowest tree pollen in Chicago, IL with an average PPM of
Weed
When is weed pollen highest in Chicago, IL?
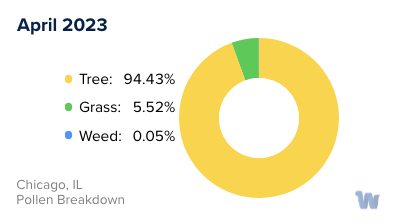
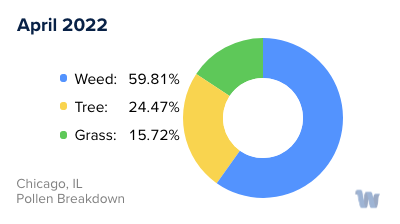
April has the highest weed pollen in Chicago, IL with an average PPM of
When is weed pollen lowest in Chicago, IL?
February has the lowest weed pollen in Chicago, IL with an average PPM of
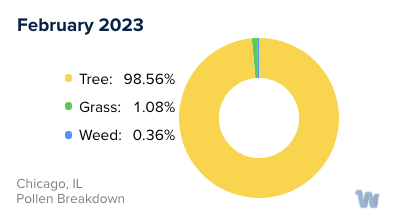
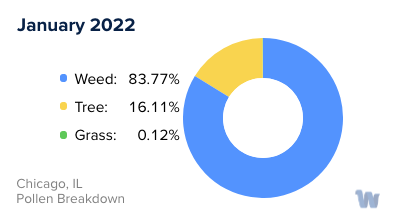
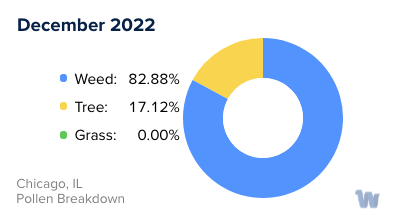
Chicago, IL Pollen Monthly Breakdown by Pollen Type

Pollen and Hay Fever in Chicago, IL
Pollen allergies, often referred to as hay fever or allergic rhinitis, are a common health concern for many residents of Chicago, Illinois. Affecting both children and adults alike, these allergies can significantly impact daily life, particularly during certain seasons when specific types of pollen are at their peak.
Chicago, like many cities, experiences high levels of tree pollen in the spring months, typically from late March to early June. During this time, trees such as oak, maple, and pine release copious amounts of pollen into the air. These tiny, almost invisible particles can travel great distances on the wind, often finding their way into homes and offices, and triggering allergy symptoms in those who are sensitive to them.
Grass pollen is another common allergen in Chicago, peaking during the late spring and early summer months. The city's many lawns, parks, and sports fields are filled with grass types like Kentucky bluegrass, ryegrass, and fescue, each releasing their own specific type of pollen. A sunny, windy day can elevate the pollen count significantly, as the pollen grains are easily carried on the wind.
By late summer and into the fall, the main concern shifts to weed pollen. Ragweed is the most notorious offender, with a single plant capable of producing up to a billion pollen grains in a season. Other weeds, like sagebrush and lamb’s quarters, can also cause problems for allergy sufferers during the autumn months.
It's important to understand that pollen levels can vary greatly from day to day, and even from hour to hour, influenced by factors such as temperature, humidity, and wind conditions. Monitoring local pollen forecasts can help Chicago residents better understand when they might be more susceptible to allergy symptoms.
While pollen allergies can be challenging, understanding the types of pollen present during different seasons in Chicago can provide a helpful starting point for managing symptoms and maintaining quality of life. Knowledge is power, and in this case, it can be the key to navigating the city's pollen seasons with confidence and comfort.