Las Vegas, NV Pollen and Allergy Report for Summer 2023

Pollen Allergy Trends in Las Vegas, NV
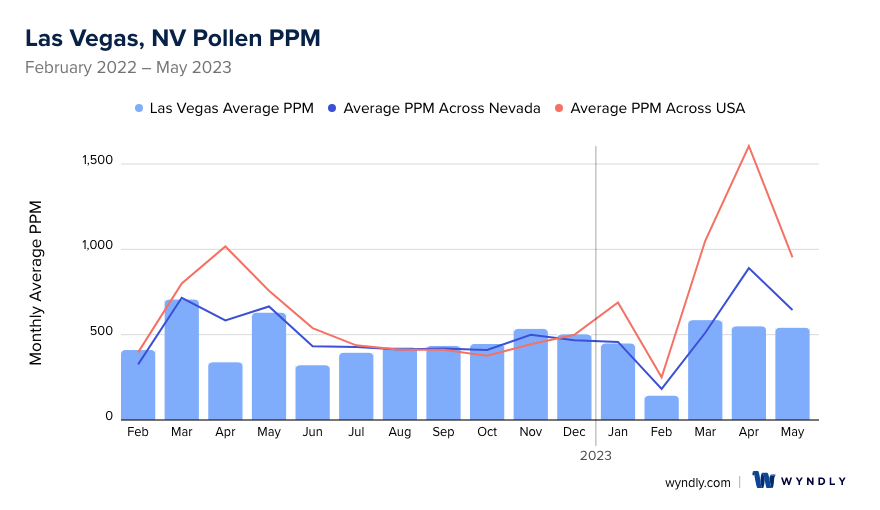
When is pollen lowest in Las Vegas, NV?
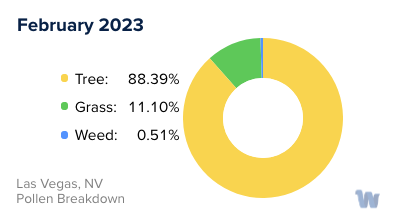
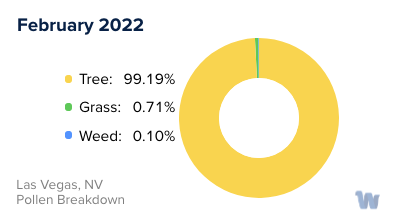
February
Lowest month total PPM
Avg. PPM
When is pollen highest in Las Vegas, NV?
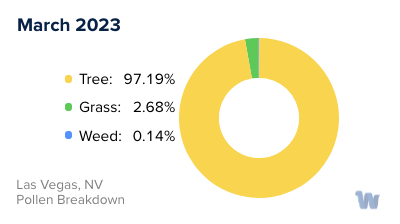
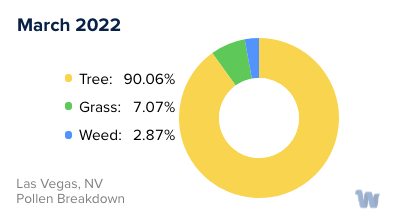
March
Highest month total PPM
Avg. PPM
How does pollen in Las Vegas, NV compare to Nevada?
Las Vegas has a lower average PPM than the state of Nevada.
Las Vegas yearly avg PPM:
Nevada yearly avg PPM:
How does pollen in Las Vegas, NV compare to the USA?
Las Vegas has a lower average PPM than the USA.
Las Vegas yearly avg PPM:
USA yearly avg PPM:
Is pollen worse this year in Las Vegas, NV?
Spring 2023 was about the same as 2022.
Spring 2023 PPM:
Spring 2022 PPM:
Average PPM in Las Vegas, NV
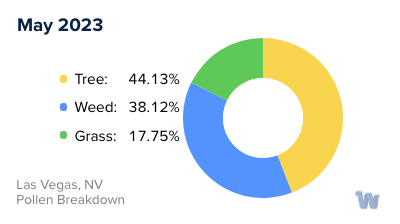
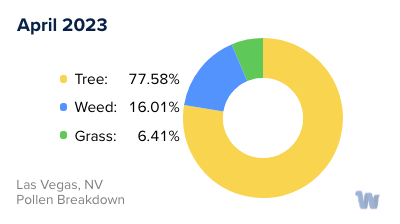
Las Vegas, NV Pollen and Allergy Breakdown by Month
Grass
When is grass pollen highest in Las Vegas, NV?
May has the highest grass pollen in Las Vegas, NV with an average PPM of
When is grass pollen lowest in Las Vegas, NV?
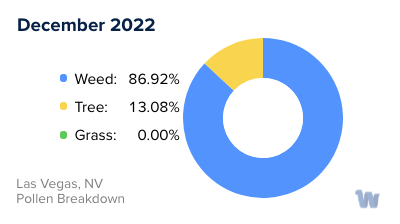
December has the lowest grass pollen in Las Vegas, NV with an average PPM of
Tree
When is tree pollen highest in Las Vegas, NV?
March has the highest tree pollen in Las Vegas, NV with an average PPM of
When is tree pollen lowest in Las Vegas, NV?
July has the lowest tree pollen in Las Vegas, NV with an average PPM of
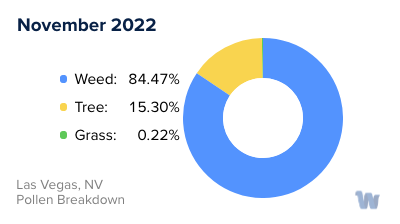
Weed
When is weed pollen highest in Las Vegas, NV?
November has the highest weed pollen in Las Vegas, NV with an average PPM of
When is weed pollen lowest in Las Vegas, NV?
February has the lowest weed pollen in Las Vegas, NV with an average PPM of
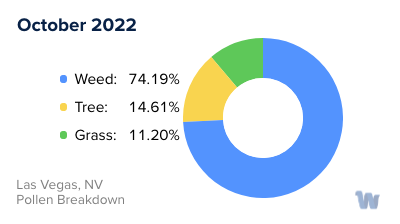
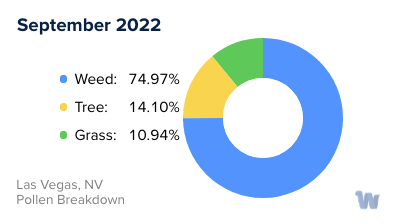
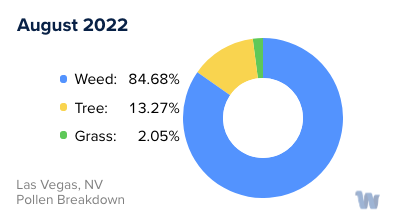
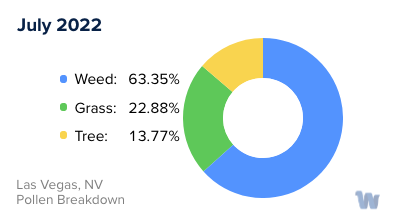
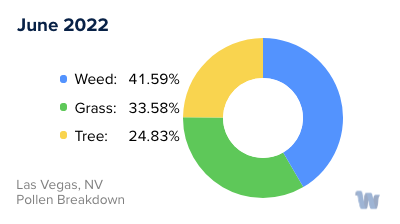
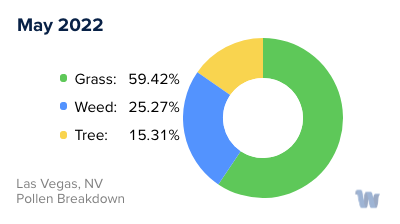
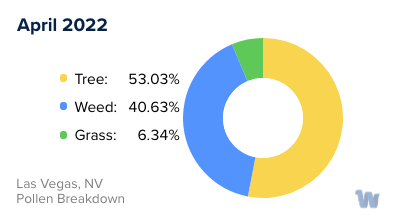
Las Vegas, NV Pollen Monthly Breakdown by Pollen Type
Pollen and Hay Fever in Las Vegas, NV
Las Vegas, renowned for its dazzling lights and entertainment, is not often associated with pollen allergies or hay fever. Yet, residents of this city nestled in the Nevada desert are no strangers to these seasonal ailments.
Pollen allergies, commonly referred to as hay fever, are caused by airborne particles from plants. When inhaled, these tiny particles can trigger an immune response in sensitive individuals, leading to symptoms such as sneezing, itchy eyes, and a runny nose. In Las Vegas, several types of pollen can contribute to these allergies.
The city's desert environment is home to a variety of plants that release pollen. Juniper trees, for example, are prevalent in the area and start producing pollen as early as February. Their pollen count peaks around March, making early spring a challenging time for allergy sufferers.
As spring progresses into summer, the pollen-producing culprits shift. Grasses take center stage, especially Bermuda grass, which is widely used in Las Vegas for landscaping. This grass is known for its high pollen production, which can exacerbate hay fever symptoms throughout the summer months.
Yet another pollen to be mindful of is that of the notorious ragweed. This plant, common in many parts of the United States, begins releasing its pollen in late summer and continues into the fall. While it isn't as prevalent in Las Vegas as in other regions, patches of ragweed can still be found in the city, making it a concern for those with hay fever.
The changing seasons in Las Vegas bring not only shifts in temperature and daylight but also transitions in the types of airborne pollen. Each new season presents different challenges for those with pollen allergies, as different plants start to release their pollen. Understanding the types of pollen and their peak times can help individuals better anticipate and manage their symptoms, even in the heart of the desert city.