Naperville, IL Pollen and Allergy Report for Summer 2023

Pollen Allergy Trends in Naperville, IL
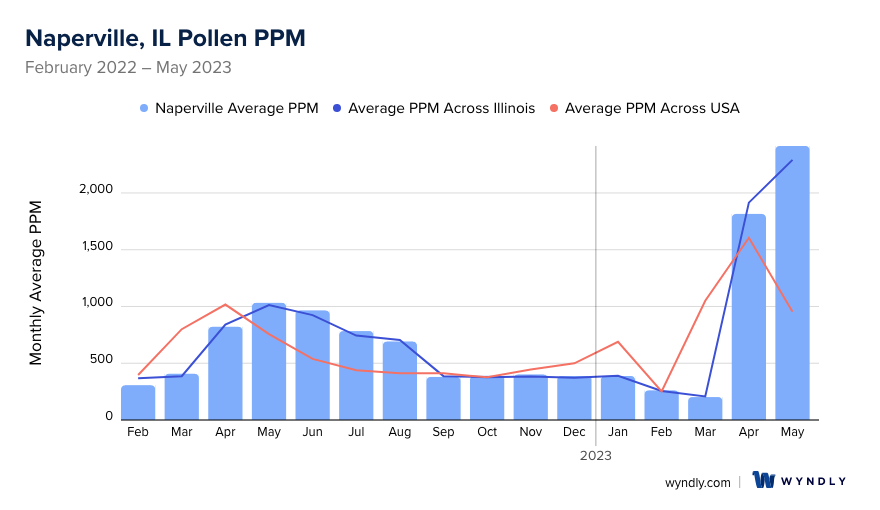
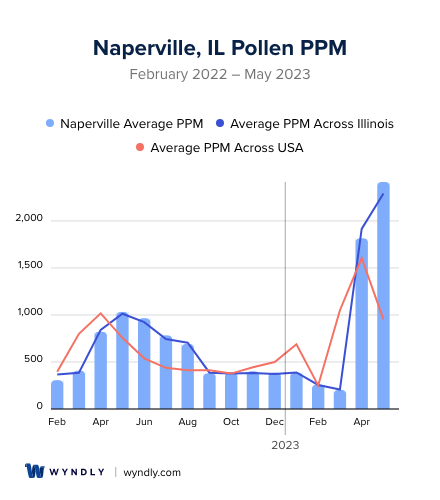
When is pollen lowest in Naperville, IL?
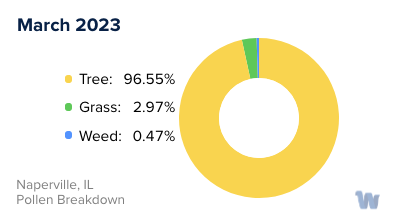
March
Lowest month total PPM
Avg. PPM
When is pollen highest in Naperville, IL?
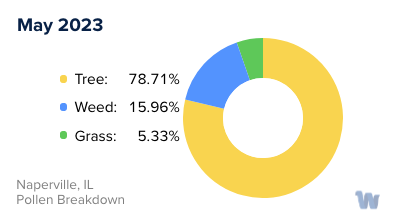
May
Highest month total PPM
Avg. PPM
How does pollen in Naperville, IL compare to Illinois?
Naperville has a higher average PPM than the state of Illinois.
Naperville yearly avg PPM:
Illinois yearly avg PPM:
How does pollen in Naperville, IL compare to the USA?
Naperville has a higher average PPM than the USA.
Naperville yearly avg PPM:
USA yearly avg PPM:
Is pollen worse this year in Naperville, IL?
Spring 2023 was worse than spring 2022.
Spring 2023 PPM:
Spring 2022 PPM:
Average PPM in Naperville, IL
Naperville, IL Pollen and Allergy Breakdown by Month
Grass
When is grass pollen highest in Naperville, IL?
July has the highest grass pollen in Naperville, IL with an average PPM of
When is grass pollen lowest in Naperville, IL?
October has the lowest grass pollen in Naperville, IL with an average PPM of
Tree
When is tree pollen highest in Naperville, IL?
May has the highest tree pollen in Naperville, IL with an average PPM of
When is tree pollen lowest in Naperville, IL?
October has the lowest tree pollen in Naperville, IL with an average PPM of
Weed
When is weed pollen highest in Naperville, IL?
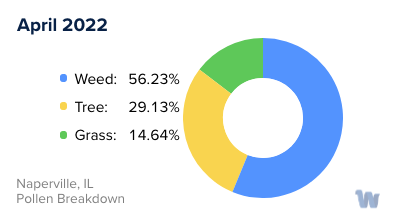
April has the highest weed pollen in Naperville, IL with an average PPM of
When is weed pollen lowest in Naperville, IL?
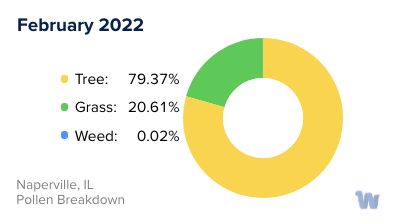
February has the lowest weed pollen in Naperville, IL with an average PPM of
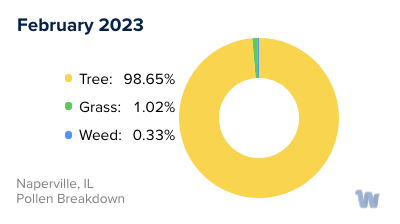
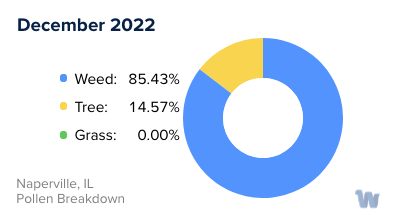
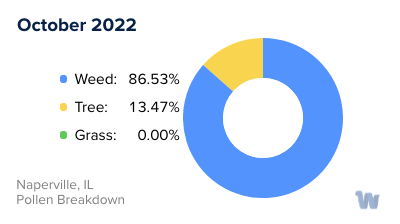
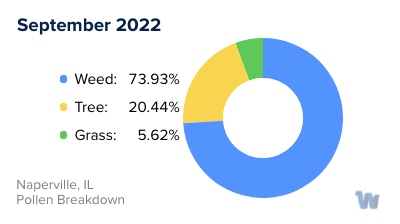
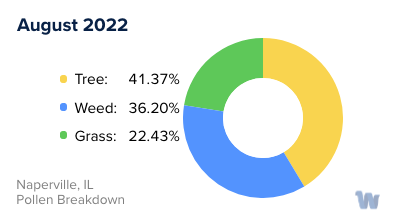
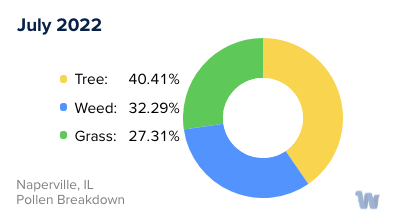
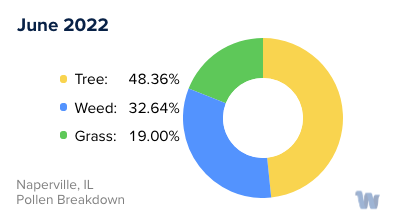
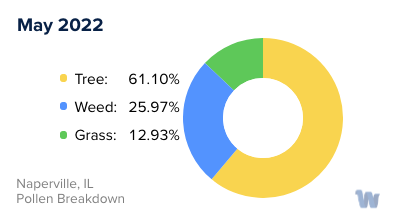
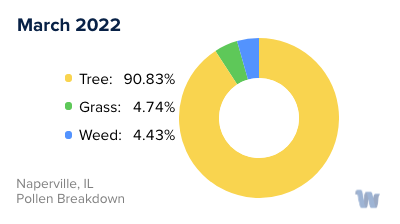
Naperville, IL Pollen Monthly Breakdown by Pollen Type


Pollen and Hay Fever in Naperville, IL
In the charming city of Naperville, Illinois, pollen allergies and hay fever are common. The major culprits causing these conditions are specific types of pollen present in different seasons.
The primary producers of pollen in Naperville are grasses, trees, and weeds. Key offenders among the grasses include ryegrass, Bermuda grass, Timothy grass, and prairie grass. In the tree category, hickory, ash, cedar, mulberry, and walnut trees contribute to the pollen count. Weeds such as ragweed, wormwood, orache, pigweed, and sagebrush also contribute significantly to the pollen problem.
Pollen allergies, also known as hay fever, can be a seasonal challenge, usually flaring up in the spring, summer, and fall. The allergy season in Naperville typically commences around late February or March, as the winter's cold recedes. During this period, residents may begin experiencing symptoms associated with pollen allergies.
The months of April, May, June, and September are particularly crucial for those suffering from pollen allergies in Naperville. These are the peak periods when pollen counts skyrocket, increasing the likelihood of triggering allergy symptoms. During these months, residents must stay vigilant, monitoring the pollen counts to manage their symptoms effectively.
Notwithstanding, the harsh, cold winters of Illinois offer a reprieve from these seasonal allergies. As temperatures drop, so do the outdoor pollen counts, providing residents with a much-needed break from their symptoms. However, it's worth noting that indoor allergens can still cause issues during the winter months, especially for those spending more time indoors.
In summary, understanding the types of pollen and the seasons in which they are prevalent can help Naperville residents better anticipate and manage their pollen allergies and hay fever symptoms, contributing to an overall improved quality of life.