Abilene, TX Pollen and Allergy Report for Summer 2023

Pollen Allergy Trends in Abilene, TX
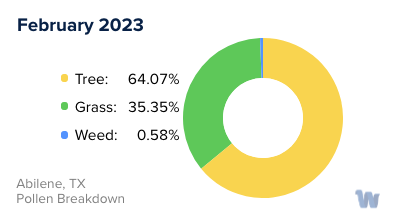
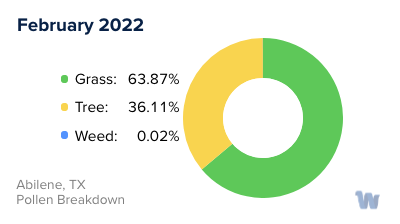
When is pollen lowest in Abilene, TX?
February
Lowest month total PPM
Avg. PPM
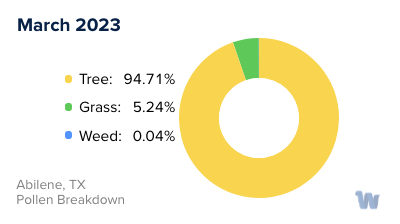
When is pollen highest in Abilene, TX?
March
Highest month total PPM
Avg. PPM
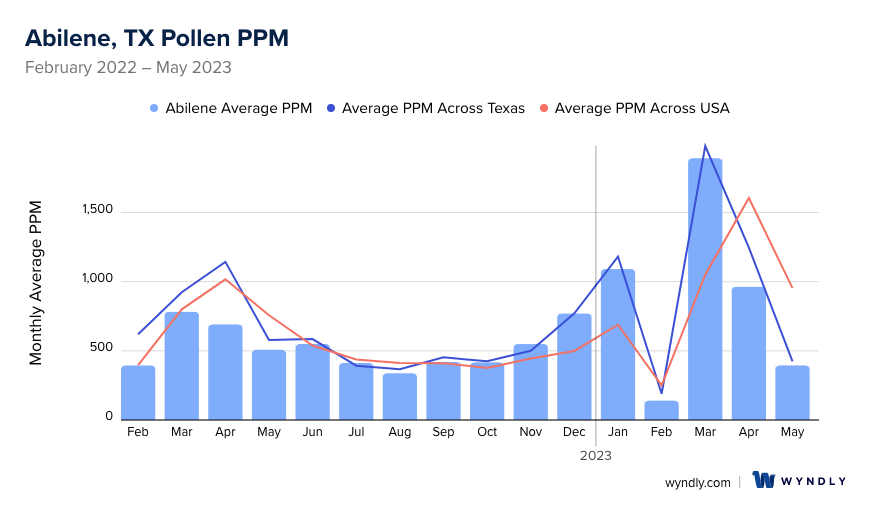
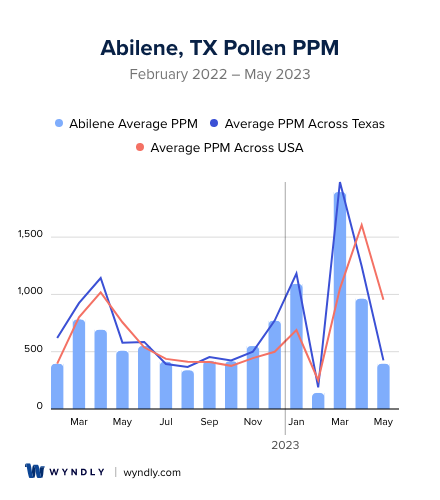
How does pollen in Abilene, TX compare to Texas?
Abilene has a lower average PPM than the state of Texas.
Abilene yearly avg PPM:
Texas yearly avg PPM:
How does pollen in Abilene, TX compare to the USA?
Abilene has a lower average PPM than the USA.
Abilene yearly avg PPM:
USA yearly avg PPM:
Is pollen worse this year in Abilene, TX?
Spring 2023 was worse than spring 2022.
Spring 2023 PPM:
Spring 2022 PPM:
Average PPM in Abilene, TX
Abilene, TX Pollen and Allergy Breakdown by Month
Grass
When is grass pollen highest in Abilene, TX?
February has the highest grass pollen in Abilene, TX with an average PPM of
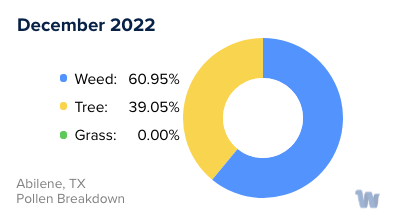
When is grass pollen lowest in Abilene, TX?
December has the lowest grass pollen in Abilene, TX with an average PPM of
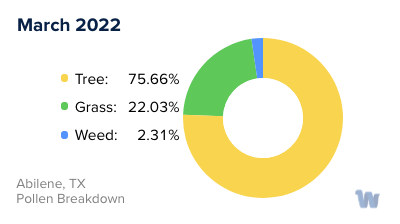
Tree
When is tree pollen highest in Abilene, TX?
March has the highest tree pollen in Abilene, TX with an average PPM of
When is tree pollen lowest in Abilene, TX?
July has the lowest tree pollen in Abilene, TX with an average PPM of
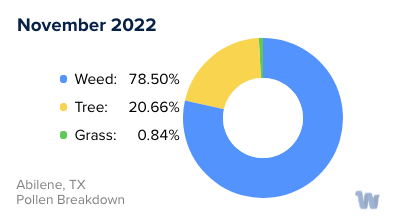
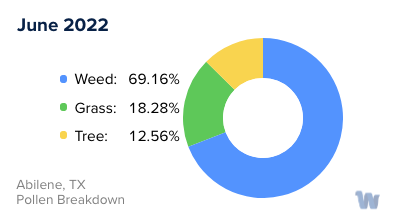
Weed
When is weed pollen highest in Abilene, TX?
December has the highest weed pollen in Abilene, TX with an average PPM of
When is weed pollen lowest in Abilene, TX?
February has the lowest weed pollen in Abilene, TX with an average PPM of
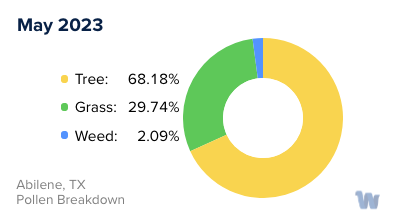
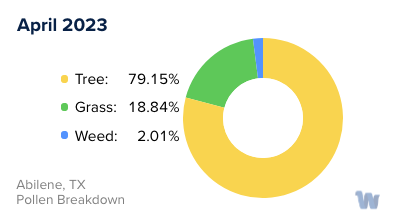
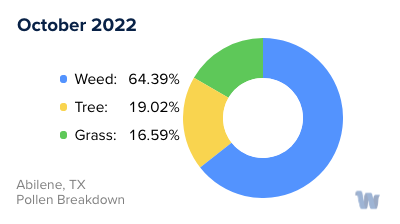
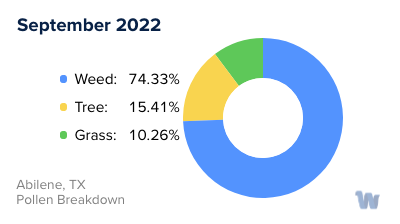
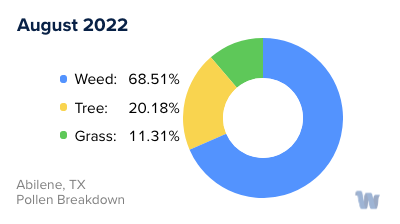
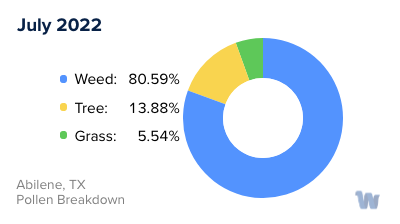
Abilene, TX Pollen Monthly Breakdown by Pollen Type

Pollen and Hay Fever in Abilene, TX
Pollen allergies, often referred to as hay fever, pose a significant health concern for the residents of Abilene, Texas. The unique environmental attributes of this region give rise to specific challenges, thereby amplifying the effects of these allergies.
Situated in the heart of the Lone Star State, Abilene is renowned for its diverse flora, with the prevalence of trees, grasses, and weeds. These plant species produce copious amounts of pollen, a fine powdery substance carried by the wind. When inhaled by individuals susceptible to allergies, pollen can trigger an overactive immune response. This leads to a myriad of uncomfortable symptoms, commonly categorized as hay fever.
The Texan city's climatic conditions further exacerbate the pollen proliferation. Abilene experiences a semi-arid climate, characterized by hot summers and mild winters. During the warmer months, plants enter their reproductive phase, leading to an increase in airborne pollen. Consequently, individuals with pollen allergies may experience heightened symptoms during this time.
Pollen concentrations can also vary based on the specific plant species native to Abilene. For instance, the region is home to several types of grasses, including Bermuda grass and Timothy grass, both notorious for their high pollen production. Similarly, the city's many oak, pine, and cedar trees can contribute to the pollen count.
In summary, pollen allergies and hay fever represent a substantial health issue for the people of Abilene, Texas. The city's diverse vegetation, coupled with its climatic characteristics, facilitates the proliferation of pollen, contributing to the prevalence of these allergies. The seasonal fluctuations in pollen count further compound the challenge, making it an ongoing concern for the allergic population. It is crucial to understand these environmental triggers and their impacts on health, even though this discussion does not include the measures to counteract them.