Cincinnati, OH Pollen and Allergy Report for Summer 2023

Pollen Allergy Trends in Cincinnati, OH
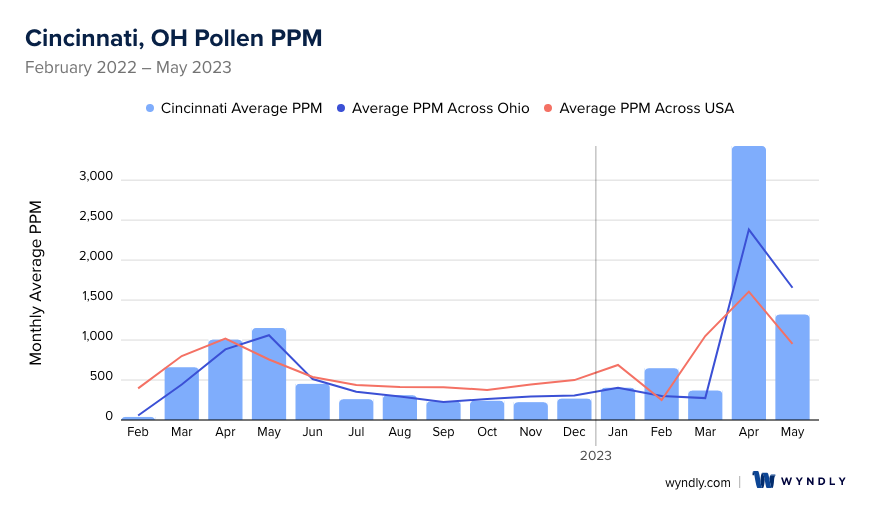
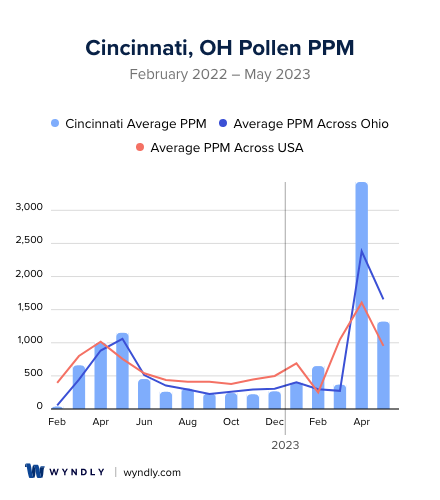
When is pollen lowest in Cincinnati, OH?
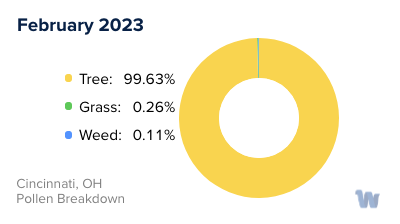
February
Lowest month total PPM
Avg. PPM
When is pollen highest in Cincinnati, OH?
April
Highest month total PPM
Avg. PPM
How does pollen in Cincinnati, OH compare to Ohio?
Cincinnati has a higher average PPM than the state of Ohio.
Cincinnati yearly avg PPM:
Ohio yearly avg PPM:
How does pollen in Cincinnati, OH compare to the USA?
Cincinnati has a higher average PPM than the USA.
Cincinnati yearly avg PPM:
USA yearly avg PPM:
Is pollen worse this year in Cincinnati, OH?
Spring 2023 was worse than spring 2022.
Spring 2023 PPM:
Spring 2022 PPM:
Average PPM in Cincinnati, OH
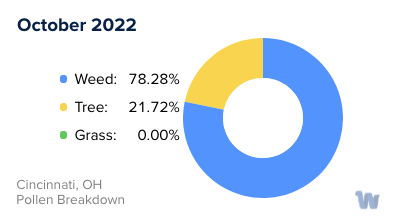
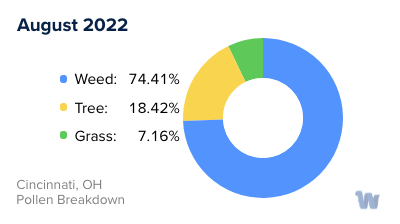
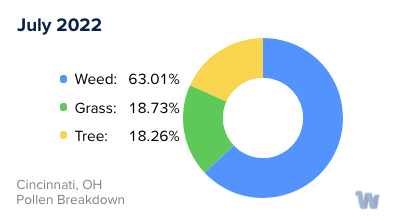
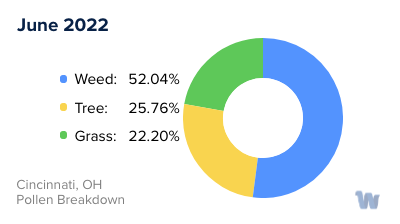
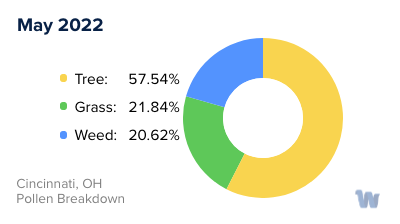
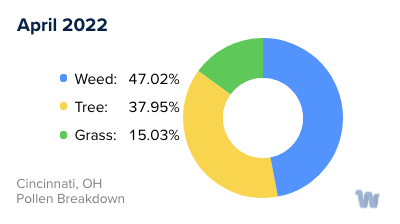
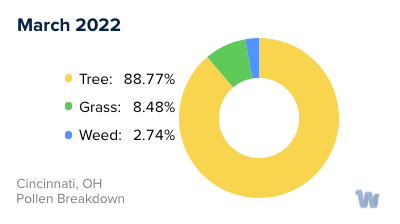
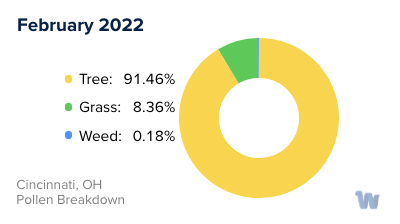
Cincinnati, OH Pollen and Allergy Breakdown by Month
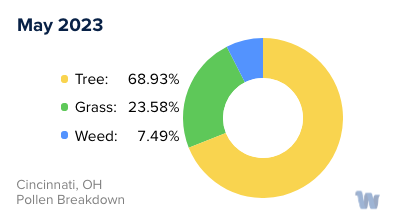
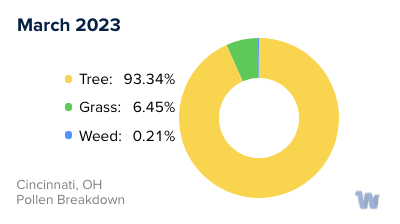
Grass
When is grass pollen highest in Cincinnati, OH?
April has the highest grass pollen in Cincinnati, OH with an average PPM of
When is grass pollen lowest in Cincinnati, OH?
September has the lowest grass pollen in Cincinnati, OH with an average PPM of
Tree
When is tree pollen highest in Cincinnati, OH?
April has the highest tree pollen in Cincinnati, OH with an average PPM of
When is tree pollen lowest in Cincinnati, OH?
February has the lowest tree pollen in Cincinnati, OH with an average PPM of
Weed
When is weed pollen highest in Cincinnati, OH?
April has the highest weed pollen in Cincinnati, OH with an average PPM of
When is weed pollen lowest in Cincinnati, OH?
February has the lowest weed pollen in Cincinnati, OH with an average PPM of
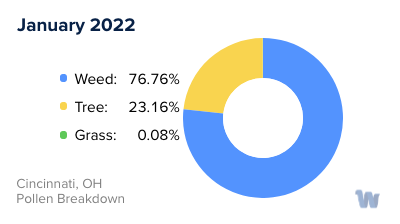
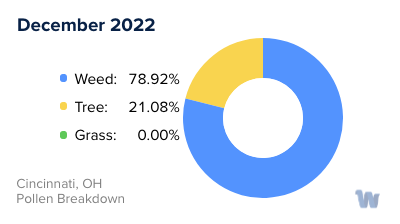
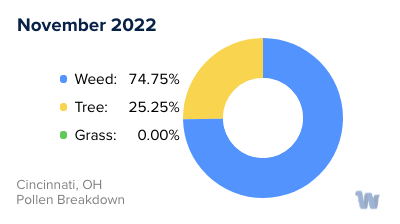
Cincinnati, OH Pollen Monthly Breakdown by Pollen Type


Pollen and Hay Fever in Cincinnati, OH
As summer warms the skies over Cincinnati, Ohio, it's not just the gentle hum of cicadas or the scent of freshly cut lawns that are in the air. There's also pollen, an unseen visitor that can trigger a range of allergy symptoms, commonly known as hay fever.
The term 'hay fever' is a bit of a misnomer, as it doesn't involve hay or induce a fever. It refers to an allergic reaction to various types of pollen released by trees, grasses, and weeds that float in the air. In Cincinnati, the pollen types that commonly lead to hay fever are tree pollen, grass pollen, and weed pollen.
The first to make their appearance are tree pollens. In Cincinnati, the trees that are often responsible for these spring allergies are oak, maple, and pine. As the weather begins to warm up from late March to May, these trees release their pollen, painting the air with invisible particles that can cause sneezing, itchy eyes, and a runny nose.
As spring merges into summer, grass pollen takes center stage. From May to July, grasses such as Timothy grass, Kentucky bluegrass, and ryegrass release their pollen. Many residents find themselves with exacerbated allergy symptoms during this period.
Finally, as the lush greenery of summer begins to fade into the rustic hues of fall, weed pollen becomes the main allergen. Ragweed is the primary culprit here, with its pollen peak occurring from late August to October. A single ragweed plant can produce up to a billion grains of pollen per season, ensuring a plentiful supply of allergens.
Each season in Cincinnati brings its own unique palette of pollens, and with it, its own set of challenges for those with hay fever. It's a city that's rich in natural beauty, but for those sensitive to pollen, it also calls for a heightened awareness of what's floating in the air.