El Cajon, CA Pollen and Allergy Report for Summer 2023

Pollen Allergy Trends in El Cajon, CA
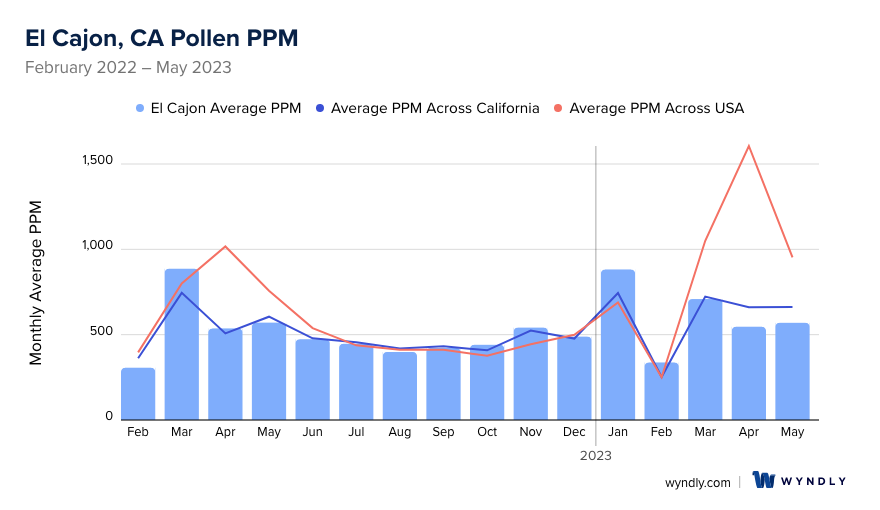
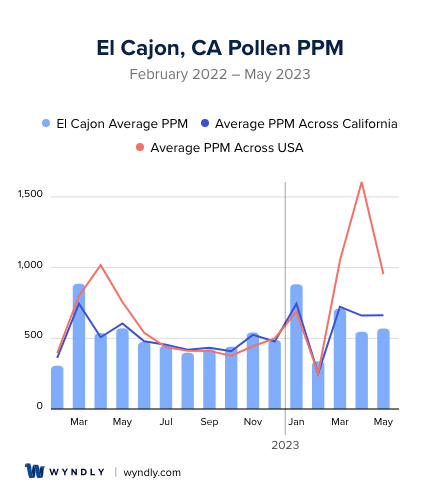
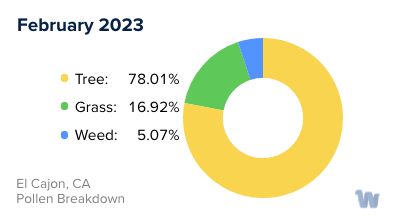
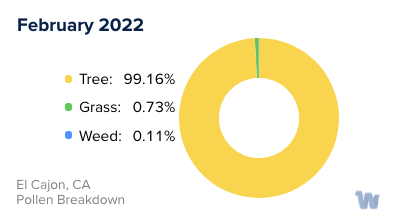
When is pollen lowest in El Cajon, CA?
February
Lowest month total PPM
Avg. PPM
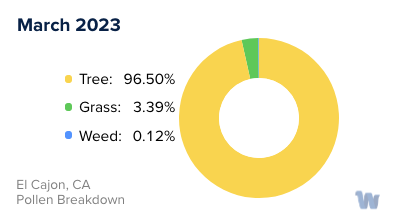
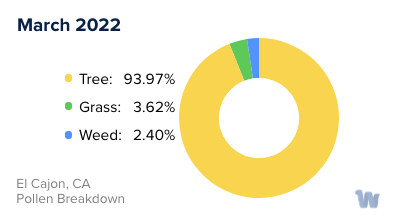
When is pollen highest in El Cajon, CA?
March
Highest month total PPM
Avg. PPM
How does pollen in El Cajon, CA compare to California?
El Cajon has a higher average PPM than the state of California.
El Cajon yearly avg PPM:
California yearly avg PPM:
How does pollen in El Cajon, CA compare to the USA?
El Cajon has a lower average PPM than the USA.
El Cajon yearly avg PPM:
USA yearly avg PPM:
Is pollen worse this year in El Cajon, CA?
Spring 2023 was better than spring 2022.
Spring 2023 PPM:
Spring 2022 PPM:
Average PPM in El Cajon, CA
El Cajon, CA Pollen and Allergy Breakdown by Month
Grass
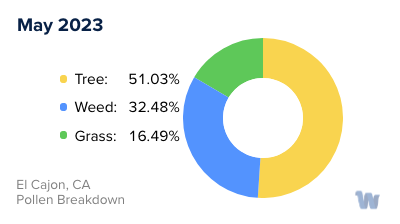
When is grass pollen highest in El Cajon, CA?
May has the highest grass pollen in El Cajon, CA with an average PPM of
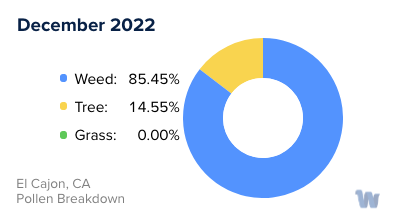
When is grass pollen lowest in El Cajon, CA?
December has the lowest grass pollen in El Cajon, CA with an average PPM of
Tree
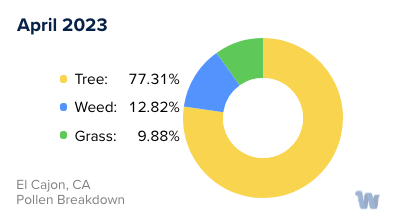
When is tree pollen highest in El Cajon, CA?
March has the highest tree pollen in El Cajon, CA with an average PPM of
When is tree pollen lowest in El Cajon, CA?
August has the lowest tree pollen in El Cajon, CA with an average PPM of
Weed
When is weed pollen highest in El Cajon, CA?
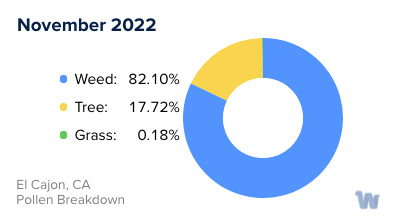
November has the highest weed pollen in El Cajon, CA with an average PPM of
When is weed pollen lowest in El Cajon, CA?
February has the lowest weed pollen in El Cajon, CA with an average PPM of
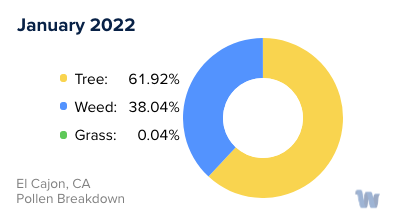
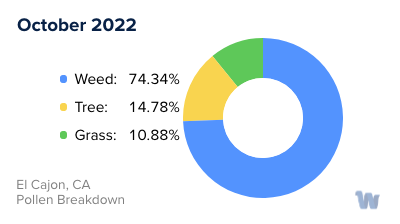
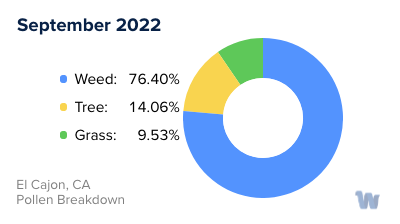
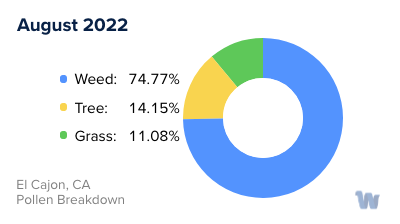
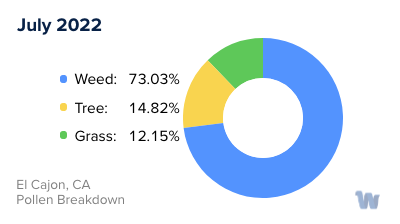
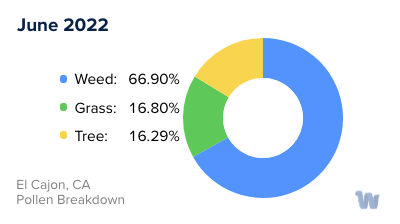
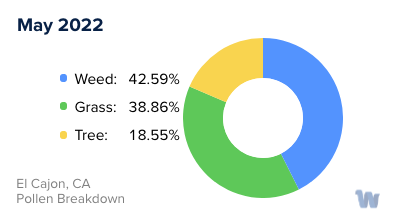
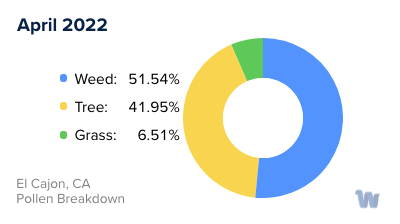
El Cajon, CA Pollen Monthly Breakdown by Pollen Type
Pollen and Hay Fever in El Cajon, CA
Pollen allergies, often referred to as hay fever, are a common concern for residents in El Cajon, California. They are typically triggered by windborne pollen produced by trees, grasses, and weeds. Let's delve into this further to understand the landscape of pollen allergies in this specific region.
El Cajon, nestled in a valley surrounded by mountains, has an environment that supports a variety of vegetation. This vegetation is the primary source of pollen. Although pollen is a natural and necessary part of the ecosystem, for those with allergies, it can cause an array of unpleasant symptoms.
Among the trees in El Cajon, oaks, pines, and olive trees are common pollen producers. Oak trees typically release their pollen from February to May, while pine trees have a slightly earlier pollen season, generally from February to April. Olive trees, on the other hand, start a bit later, generally from March to June.
In addition to trees, grasses are another common source of pollen. Bermuda grass, a common grass species in Southern California, releases pollen from May to October. Another frequent offender, ryegrass, shares a similar pollen season, typically from April to June.
Weeds, despite their smaller stature, are not to be underestimated when it comes to pollen production. Ragweed, a common weed in California, tends to release its pollen from July to October. Meanwhile, sagebrush, another prevalent weed in the area, generally releases pollen from August to November.
The climate of El Cajon, with its mild, wet winters and hot, dry summers, contributes to the area's extended pollen seasons. The specific timing and intensity of these pollen seasons can vary year-to-year based on weather patterns, but the general timeframe tends to stay consistent.
In summary, residents of El Cajon are exposed to a variety of pollens throughout the year, from the early-spring oak and pine pollen, to the late-summer and fall weed pollens. Awareness of these patterns can help those affected by pollen allergies anticipate and prepare for the seasons ahead.