Aurora, IL Pollen and Allergy Report for Summer 2023

Pollen Allergy Trends in Aurora, IL
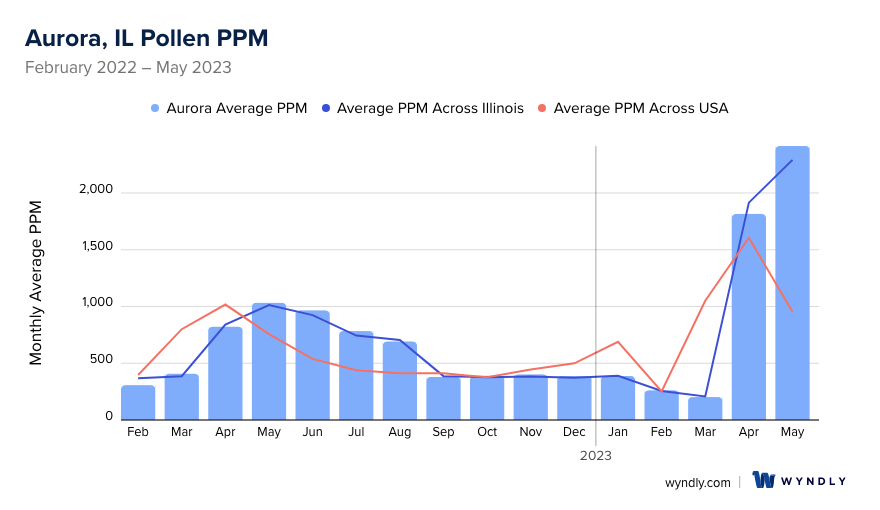
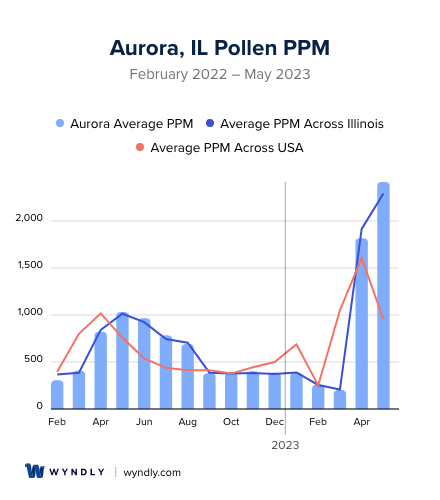
When is pollen lowest in Aurora, IL?
March
Lowest month total PPM
Avg. PPM
When is pollen highest in Aurora, IL?
May
Highest month total PPM
Avg. PPM
How does pollen in Aurora, IL compare to Illinois?
Aurora has a higher average PPM than the state of Illinois.
Aurora yearly avg PPM:
Illinois yearly avg PPM:
How does pollen in Aurora, IL compare to the USA?
Aurora has a higher average PPM than the USA.
Aurora yearly avg PPM:
USA yearly avg PPM:
Is pollen worse this year in Aurora, IL?
Spring 2023 was worse than spring 2022.
Spring 2023 PPM:
Spring 2022 PPM:
Average PPM in Aurora, IL
Aurora, IL Pollen and Allergy Breakdown by Month
Grass
When is grass pollen highest in Aurora, IL?
July has the highest grass pollen in Aurora, IL with an average PPM of
When is grass pollen lowest in Aurora, IL?
October has the lowest grass pollen in Aurora, IL with an average PPM of
Tree
When is tree pollen highest in Aurora, IL?
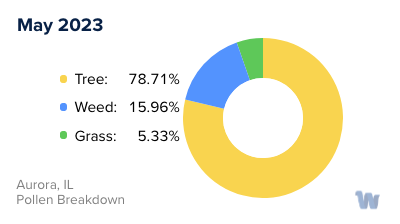
May has the highest tree pollen in Aurora, IL with an average PPM of
When is tree pollen lowest in Aurora, IL?
October has the lowest tree pollen in Aurora, IL with an average PPM of
Weed
When is weed pollen highest in Aurora, IL?
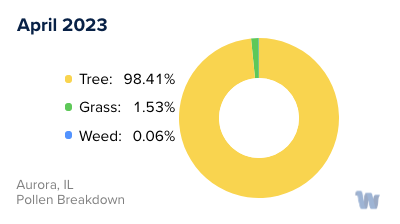
April has the highest weed pollen in Aurora, IL with an average PPM of
When is weed pollen lowest in Aurora, IL?
February has the lowest weed pollen in Aurora, IL with an average PPM of
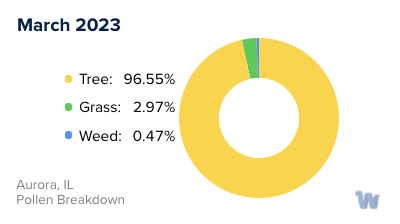
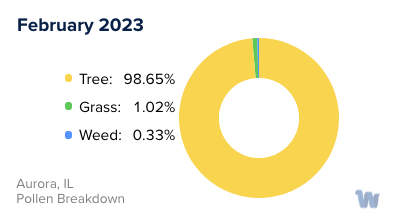
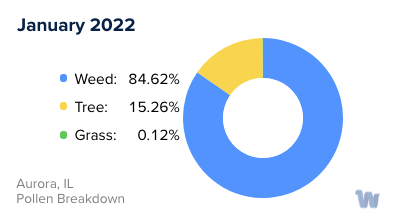
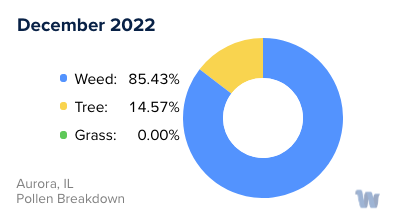
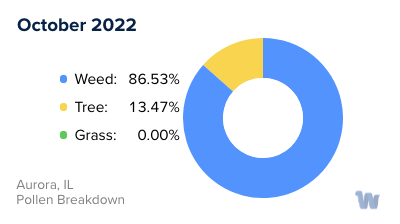
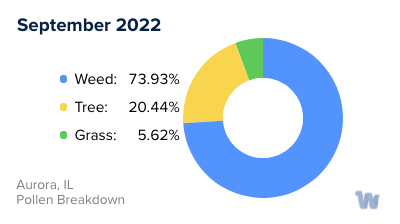
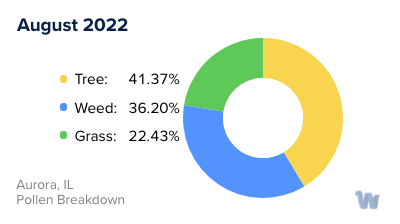
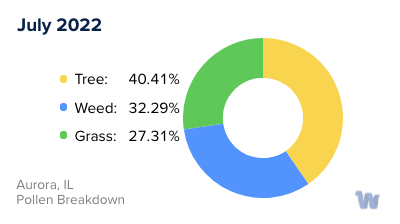
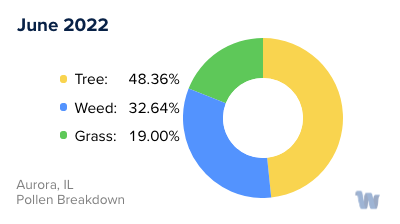
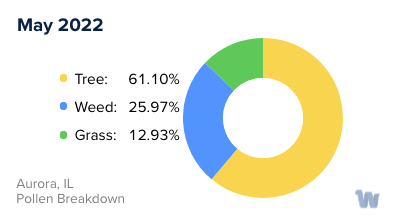
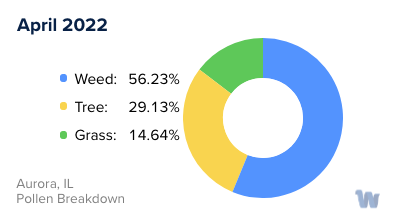
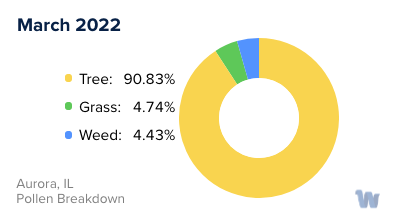
Aurora, IL Pollen Monthly Breakdown by Pollen Type

Pollen and Hay Fever in Aurora, IL
In Aurora, Illinois, residents must be mindful of pollen allergies, often referred to as hay fever. These allergies are predominantly caused by the presence of pollen in the air, released by plants during specific times of the year. In Aurora, the main types of pollen that trigger allergies are from trees, grasses, and ragweed.
Tree pollen is a major concern, with species such as hickory, ash, cedar, mulberry, and walnut being some of the main culprits. Tree pollen levels can be particularly high in the early spring, commonly starting around late February or March. Grass pollen is another significant allergen. Species like ryegrass, Bermuda grass, Timothy grass, and prairie grass release pollen that can cause allergic reactions. Grass pollen usually reaches peak levels in the late spring and early summer.
Ragweed pollen is also a significant allergen, particularly in late summer and fall. While ragweed pollen might not be as prevalent as tree and grass pollen, it can still pose a significant challenge for individuals with allergies, particularly during the peak months of September.
Seasonal allergies tend to peak in April, May, June, and September, so residents should be mindful during these months. Winter typically provides a respite from pollen allergies due to the cold climate that inhibits the growth and pollen production of many plants.
However, it's important to note that the severity and timing of allergy seasons can vary from year to year, based on factors such as weather patterns and plant growth cycles. Therefore, even though this gives a general idea of when to expect higher pollen levels, it might not be entirely accurate every year.
In conclusion, pollen allergies in Aurora, Illinois, are predominantly caused by tree, grass, and ragweed pollen. The allergy season typically starts in late February or early March and extends until the first frost of winter, with peak pollen levels usually seen in April, May, June, and September.