Grand Rapids, MI Pollen and Allergy Report for Summer 2023

Pollen Allergy Trends in Grand Rapids, MI
When is pollen lowest in Grand Rapids, MI?
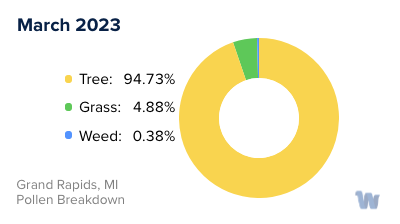
March
Lowest month total PPM
Avg. PPM
When is pollen highest in Grand Rapids, MI?
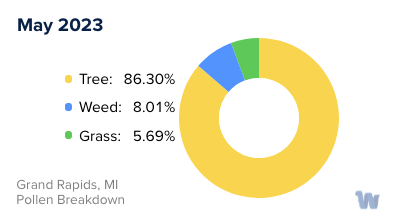
May
Highest month total PPM
Avg. PPM
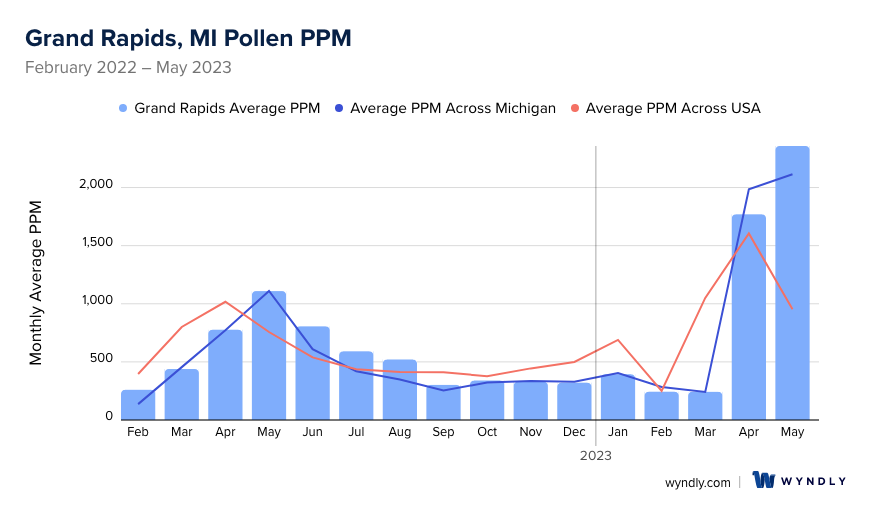
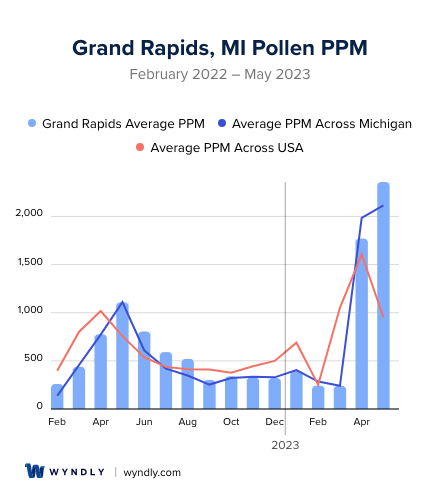
How does pollen in Grand Rapids, MI compare to Michigan?
Grand Rapids has a higher average PPM than the state of Michigan.
Grand Rapids yearly avg PPM:
Michigan yearly avg PPM:
How does pollen in Grand Rapids, MI compare to the USA?
Grand Rapids has a higher average PPM than the USA.
Grand Rapids yearly avg PPM:
USA yearly avg PPM:
Is pollen worse this year in Grand Rapids, MI?
Spring 2023 was worse than spring 2022.
Spring 2023 PPM:
Spring 2022 PPM:
Average PPM in Grand Rapids, MI
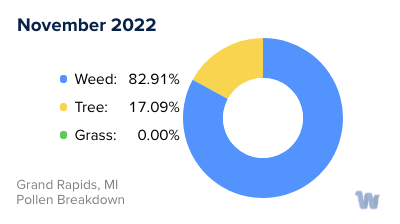
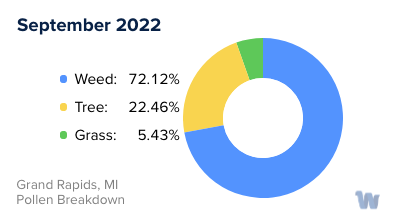
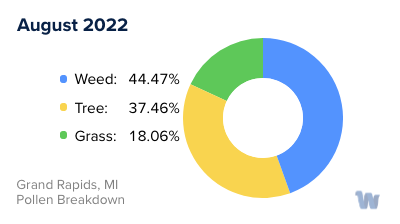
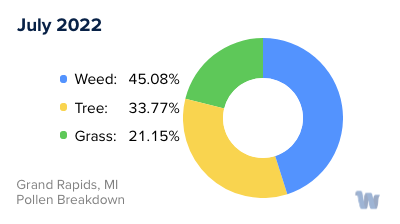
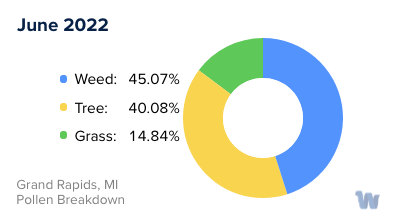
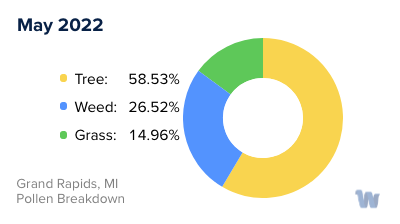
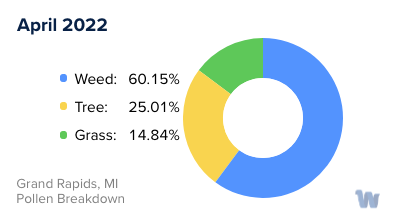
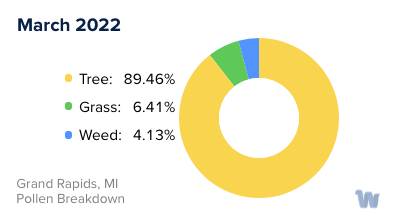
Grand Rapids, MI Pollen and Allergy Breakdown by Month
Grass
When is grass pollen highest in Grand Rapids, MI?
May has the highest grass pollen in Grand Rapids, MI with an average PPM of
When is grass pollen lowest in Grand Rapids, MI?
October has the lowest grass pollen in Grand Rapids, MI with an average PPM of
Tree
When is tree pollen highest in Grand Rapids, MI?
May has the highest tree pollen in Grand Rapids, MI with an average PPM of
When is tree pollen lowest in Grand Rapids, MI?
October has the lowest tree pollen in Grand Rapids, MI with an average PPM of
Weed
When is weed pollen highest in Grand Rapids, MI?
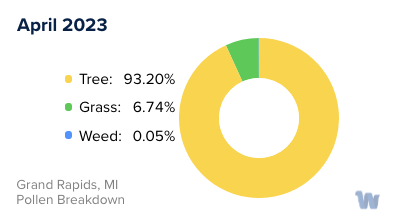
April has the highest weed pollen in Grand Rapids, MI with an average PPM of
When is weed pollen lowest in Grand Rapids, MI?
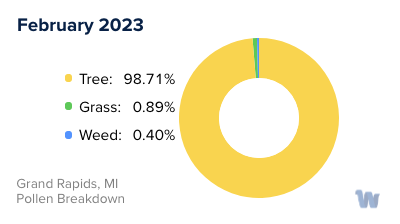
February has the lowest weed pollen in Grand Rapids, MI with an average PPM of
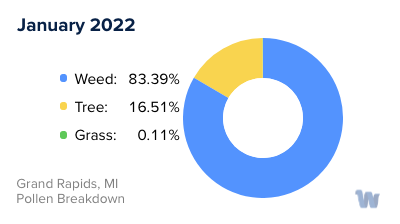
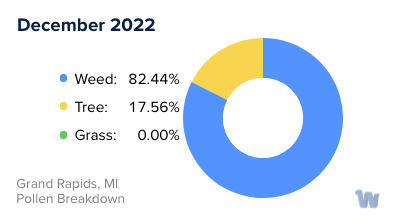
Grand Rapids, MI Pollen Monthly Breakdown by Pollen Type

Pollen and Hay Fever in Grand Rapids, MI
As spring and summer unfurl in Grand Rapids, Michigan, a less welcome guest often arrives on the scene: pollen. This seemingly innocent natural substance, crucial to the reproductive processes of many plants, can cause a flurry of uncomfortable symptoms in people with allergies, a condition often referred to as hay fever.
In Grand Rapids, a variety of plants produce pollen known to trigger allergies. The city's rich green spaces, filled with grasses and trees, are a delight to the eye but can be a challenge for allergy sufferers.
The primary culprits in the spring months are trees. From late March to mid-May, residents may find themselves sneezing and sniffling due to tree pollen. Oak, maple, and pine are among the most prevalent tree species in the area, and these produce an abundance of fine, windborne pollen particles that can irritate sensitive respiratory systems.
In the summer months, starting from late May and extending to August, grass pollen takes center stage. Grand Rapids is home to a variety of grass species, including timothy, ryegrass, and Kentucky bluegrass. These grasses release their pollen into the air, becoming a potent allergen for many residents.
Fall is not a reprieve for allergy sufferers in Grand Rapids either. From late August until the first frost, usually in October, weed pollen is the dominant allergen. Ragweed, a plant species that thrives in the region's climate, releases copious amounts of pollen during this time.
The changing seasons in Grand Rapids thus bring a changing roster of allergenic pollens. For residents and visitors with hay fever, understanding the types of pollen present in different seasons can help them prepare for and manage their symptoms, allowing them to enjoy the city's natural beauty in comfort and good health.