Minneapolis, MN Pollen and Allergy Report for Summer 2023

Pollen Allergy Trends in Minneapolis, MN
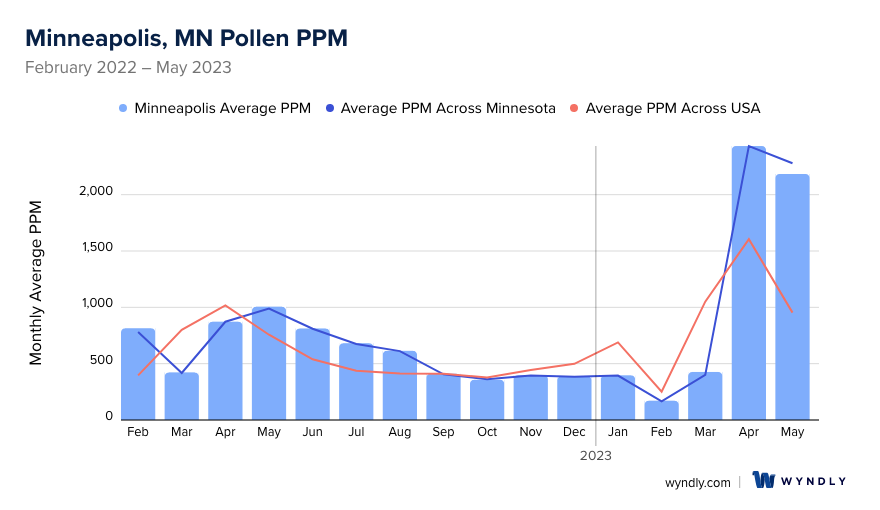
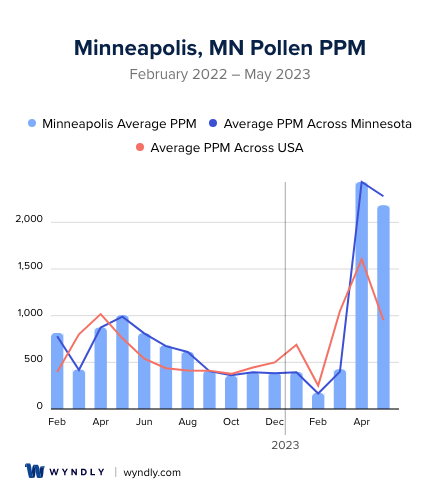
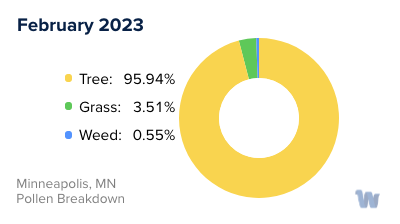
When is pollen lowest in Minneapolis, MN?
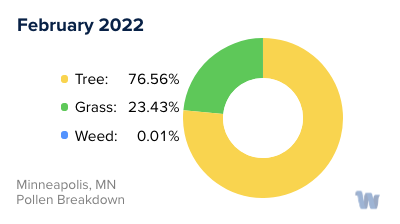
February
Lowest month total PPM
Avg. PPM
When is pollen highest in Minneapolis, MN?
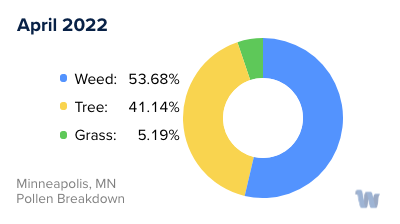
April
Highest month total PPM
Avg. PPM
How does pollen in Minneapolis, MN compare to Minnesota?
Minneapolis has a higher average PPM than the state of Minnesota.
Minneapolis yearly avg PPM:
Minnesota yearly avg PPM:
How does pollen in Minneapolis, MN compare to the USA?
Minneapolis has a higher average PPM than the USA.
Minneapolis yearly avg PPM:
USA yearly avg PPM:
Is pollen worse this year in Minneapolis, MN?
Spring 2023 was worse than spring 2022.
Spring 2023 PPM:
Spring 2022 PPM:
Average PPM in Minneapolis, MN
Minneapolis, MN Pollen and Allergy Breakdown by Month
Grass
When is grass pollen highest in Minneapolis, MN?
February has the highest grass pollen in Minneapolis, MN with an average PPM of
When is grass pollen lowest in Minneapolis, MN?
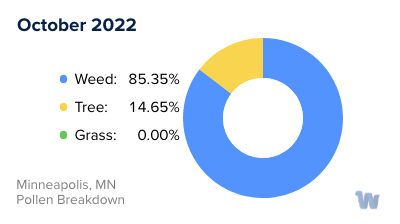
October has the lowest grass pollen in Minneapolis, MN with an average PPM of
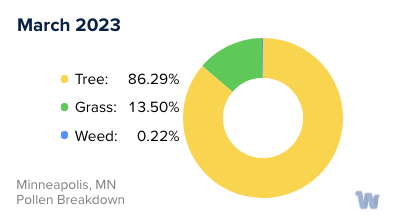
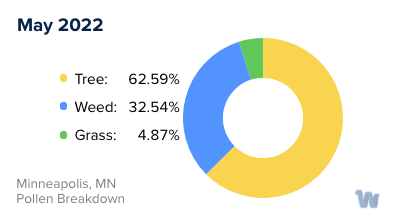
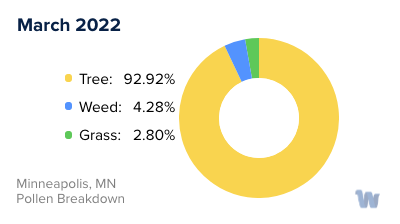
Tree
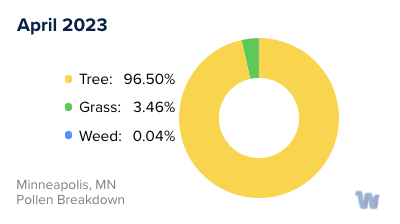
When is tree pollen highest in Minneapolis, MN?
April has the highest tree pollen in Minneapolis, MN with an average PPM of
When is tree pollen lowest in Minneapolis, MN?
October has the lowest tree pollen in Minneapolis, MN with an average PPM of
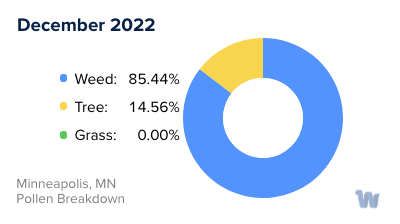
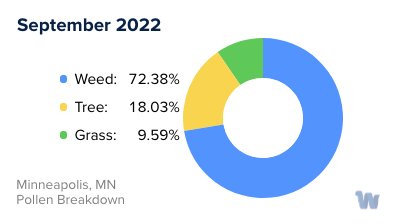
Weed
When is weed pollen highest in Minneapolis, MN?
April has the highest weed pollen in Minneapolis, MN with an average PPM of
When is weed pollen lowest in Minneapolis, MN?
February has the lowest weed pollen in Minneapolis, MN with an average PPM of
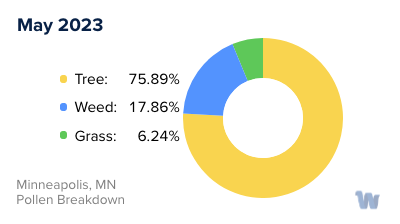
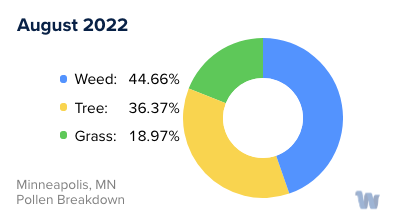
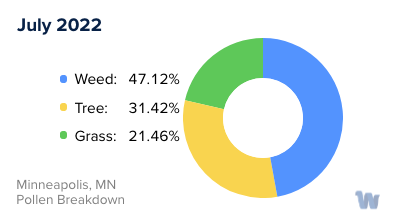
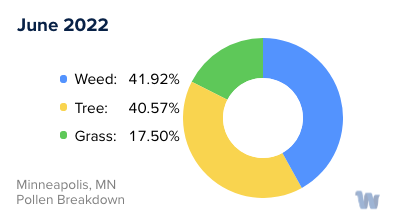
Minneapolis, MN Pollen Monthly Breakdown by Pollen Type


Pollen and Hay Fever in Minneapolis, MN
Pollen allergies, often referred to as hay fever or allergic rhinitis, are a widespread health issue in Minneapolis, Minnesota. This Midwestern city is home to a diverse variety of flora that contribute to the seasonal pollen count, and subsequently, the allergies experienced by its residents.
In the springtime, from late March to early June, tree pollen is typically the main culprit. The city's abundant deciduous trees, including oak, elm, and maple, burst into bloom, releasing microscopic pollen grains into the air. Pine and cedar trees, while less common, also contribute to the pollen count. For those sensitive to tree pollen, this time of year can be particularly challenging, with symptoms like sneezing, itchy eyes, and a runny nose being commonplace.
Grass pollen follows in the late spring and early summer, from May to July. Minneapolis is home to a variety of grass species, with Kentucky bluegrass, ryegrass, and fescue being particularly common. These grasses release their pollen, which is carried by the wind, leading to another wave of hay fever symptoms among susceptible individuals.
Finally, in late summer and fall, from August to October, weed pollen takes center stage. The most notorious of these is ragweed, a plant that thrives in the Midwest's fertile soils. Its pollen is incredibly lightweight and can travel great distances on the breeze, impacting many residents of Minneapolis.
While there's a distinct pattern to the pollen seasons in Minneapolis, it's worth noting that weather conditions can affect pollen levels significantly. Warm, dry, and windy days can cause pollen counts to soar, while rain can help to cleanse the air, providing temporary relief for allergy sufferers.
Understanding the types of pollen and their seasonal cycles can help those living in or visiting Minneapolis better anticipate and manage their hay fever symptoms, even if it's just knowing when it might be wise to stay indoors or avoid certain outdoor activities.