Antioch, CA Pollen and Allergy Report for Summer 2023

Pollen Allergy Trends in Antioch, CA
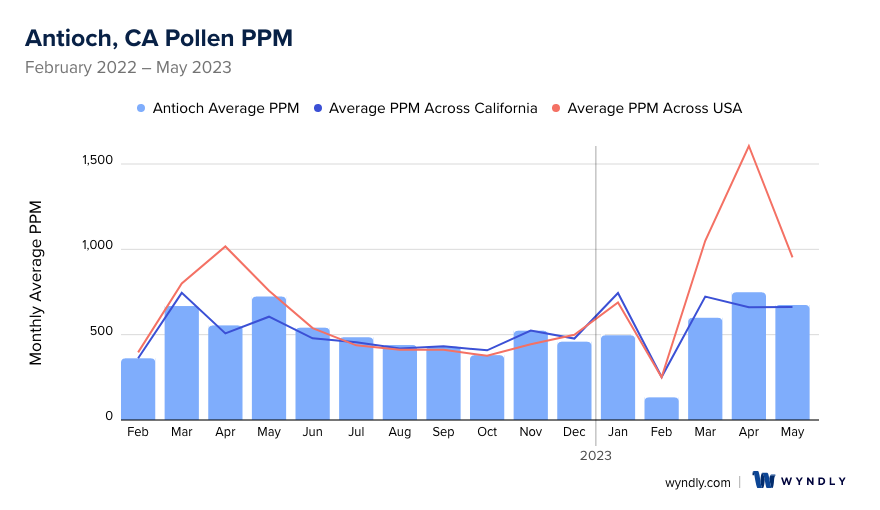
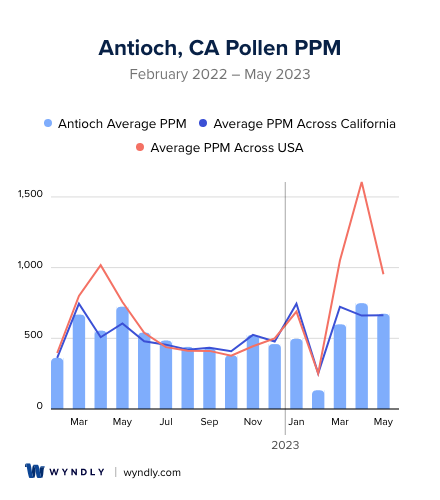
When is pollen lowest in Antioch, CA?
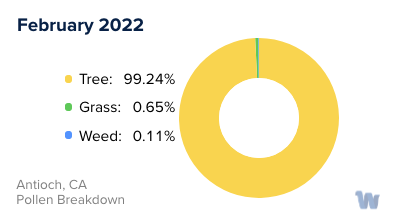
February
Lowest month total PPM
Avg. PPM
When is pollen highest in Antioch, CA?
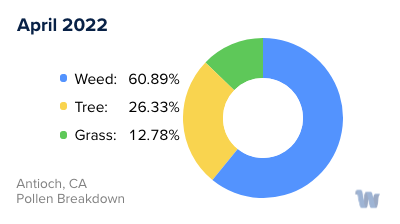
April
Highest month total PPM
Avg. PPM
How does pollen in Antioch, CA compare to California?
Antioch has a lower average PPM than the state of California.
Antioch yearly avg PPM:
California yearly avg PPM:
How does pollen in Antioch, CA compare to the USA?
Antioch has a lower average PPM than the USA.
Antioch yearly avg PPM:
USA yearly avg PPM:
Is pollen worse this year in Antioch, CA?
Spring 2023 was about the same as 2022.
Spring 2023 PPM:
Spring 2022 PPM:
Average PPM in Antioch, CA
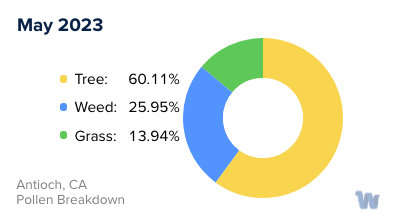
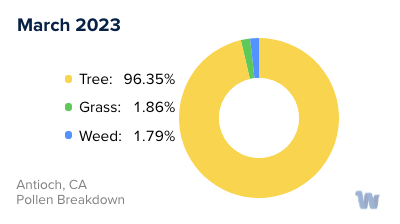
Antioch, CA Pollen and Allergy Breakdown by Month
Grass
When is grass pollen highest in Antioch, CA?
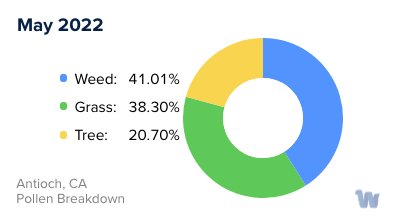
May has the highest grass pollen in Antioch, CA with an average PPM of
When is grass pollen lowest in Antioch, CA?
December has the lowest grass pollen in Antioch, CA with an average PPM of
Tree
When is tree pollen highest in Antioch, CA?
April has the highest tree pollen in Antioch, CA with an average PPM of
When is tree pollen lowest in Antioch, CA?
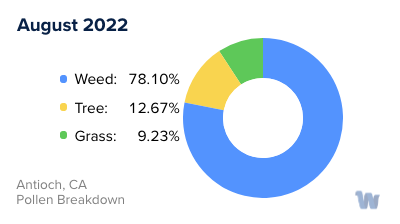
August has the lowest tree pollen in Antioch, CA with an average PPM of
Weed
When is weed pollen highest in Antioch, CA?
November has the highest weed pollen in Antioch, CA with an average PPM of
When is weed pollen lowest in Antioch, CA?
February has the lowest weed pollen in Antioch, CA with an average PPM of
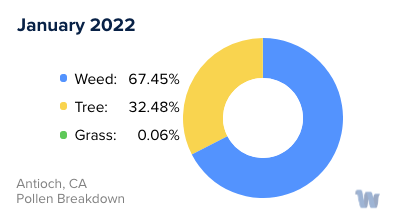
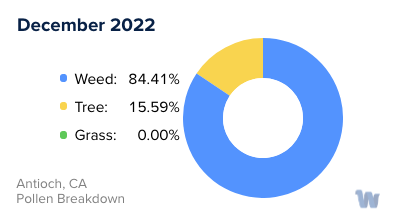
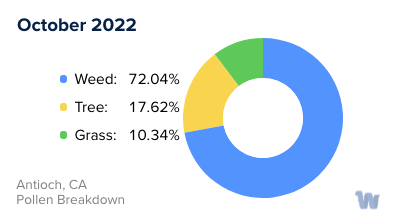
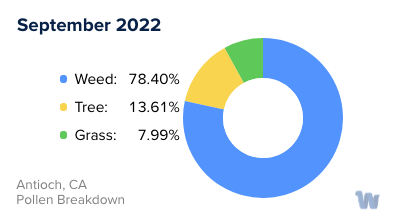
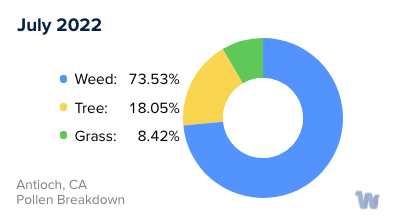
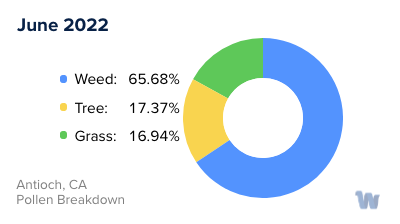
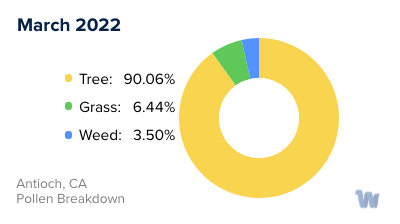
Antioch, CA Pollen Monthly Breakdown by Pollen Type


Pollen and Hay Fever in Antioch, CA
Pollen allergies and hay fever, while not exclusive to Antioch, California, pose a significant challenge to the residents of this vibrant city, especially during certain periods of the year. The types of pollen that are prevalent in Antioch and the surrounding areas are predominantly from trees, but the city is not immune to other sources.
A variety of trees contribute to the pollen count in Antioch. Among them are oak, olive, ash, cedar, and eucalyptus trees. Additionally, other plants such as ryegrass, bluegrass, sagebrush, ragweed, Russian thistle, and mulberry can also contribute to the airborne pollen levels, triggering allergic responses in susceptible individuals.
Understanding the seasonal nature of pollen allergies is key to managing your day-to-day activities. In California, the allergy season typically starts around late January and persists until early October. However, peak pollen counts occur in April, May, and September, marking these months as the most challenging for those with allergies. During these periods, outdoor activities may lead to increased exposure to pollen and subsequent allergic reactions.
Although the allergy season in Antioch and the rest of California usually ends in October or November, it is important to note that indoor allergens can continue to cause issues for allergy sufferers during the milder winter months. Therefore, even when the outdoor pollen count drops, indoor allergens such as dust, pet dander, or mold can still lead to allergic reactions.
In conclusion, the city of Antioch, like many parts of California, has a variety of pollen sources that can trigger allergies. The seasonal nature of these allergies, with peak periods in spring and fall, can pose challenges to residents and visitors alike. Awareness of these pollen sources and their seasonal variations can help individuals better manage their exposure and mitigate the impact of these allergens on their daily lives.