Oceanside, CA Pollen and Allergy Report for Summer 2023

Pollen Allergy Trends in Oceanside, CA

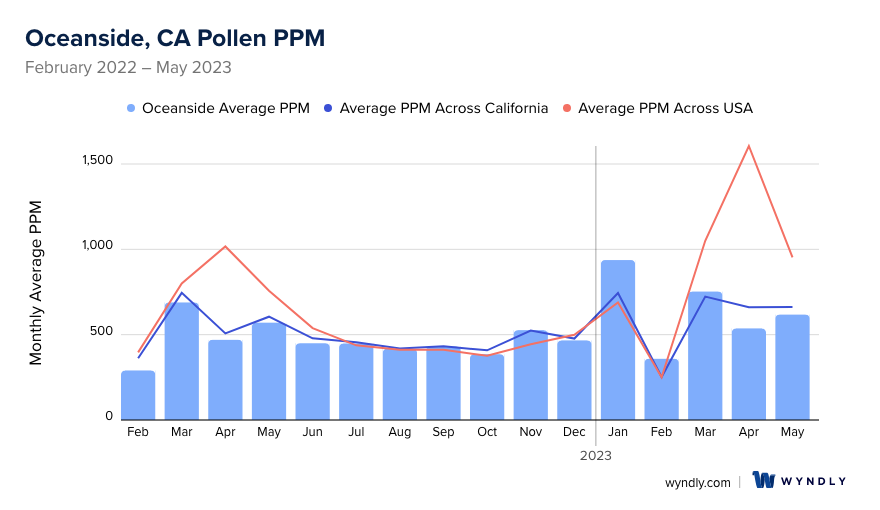
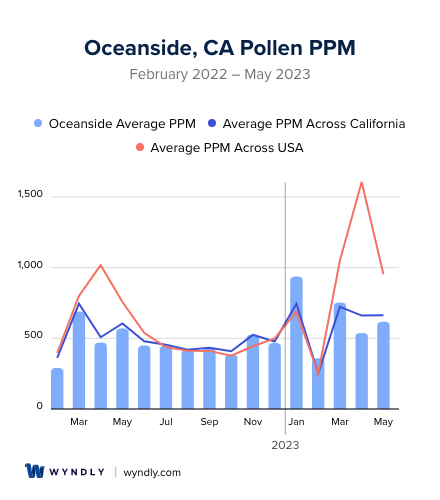
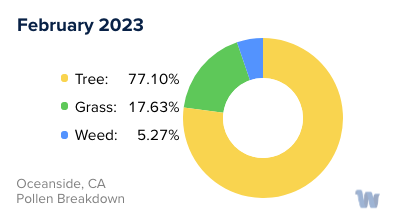
When is pollen lowest in Oceanside, CA?

Green down arrow

February

Lowest month total PPM

290.23 Avg. PPM

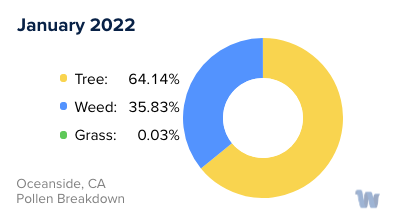
When is pollen highest in Oceanside, CA?

Red up arrow

January

Highest month total PPM

937.14 Avg. PPM

How does pollen in Oceanside, CA compare to California?

Oceanside has a lower average PPM than the state of California.

Oceanside yearly avg PPM: 521.6

California yearly avg PPM: 528.52

How does pollen in Oceanside, CA compare to the USA?

Oceanside has a lower average PPM than the USA.

Oceanside yearly avg PPM: 521.6

USA yearly avg PPM: 664.86

Is pollen worse this year in Oceanside, CA?

Spring 2023 was worse than spring 2022.

Spring 2023 PPM: 1,906.72

Spring 2022 PPM: 1,728.56

Average PPM in Oceanside, CA

Oceanside, CA Average PPM Oceanside, CA Average PPM

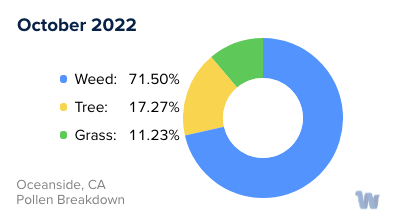
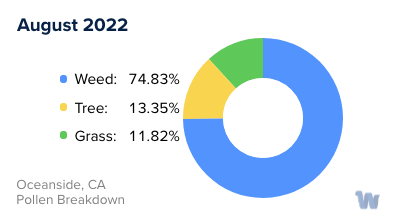
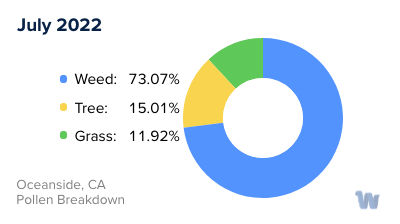
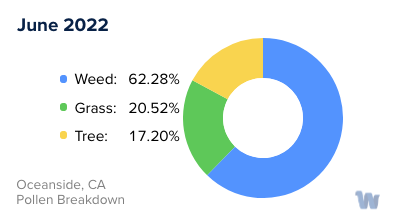
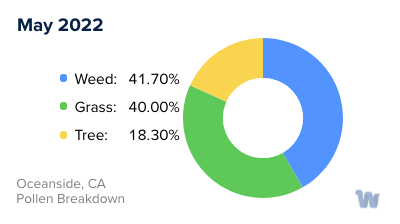
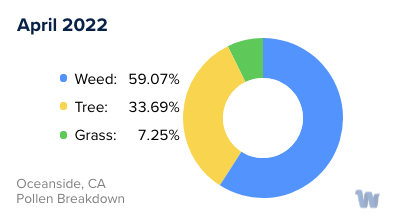
Oceanside, CA Pollen and Allergy Breakdown by Month
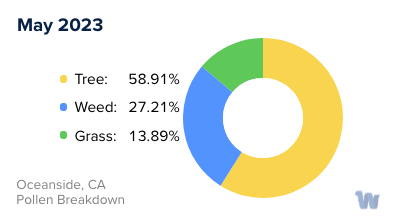
Grass

When is grass pollen highest in Oceanside, CA?

May has the highest grass pollen in Oceanside, CA with an average PPM of 228.1

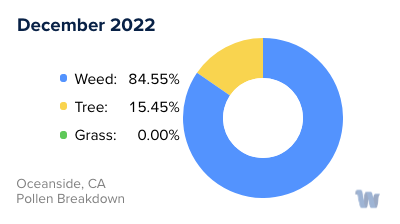
When is grass pollen lowest in Oceanside, CA?

December has the lowest grass pollen in Oceanside, CA with an average PPM of
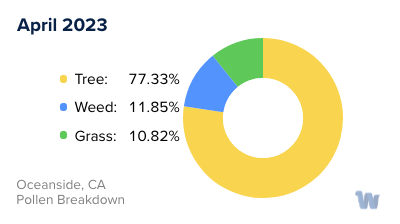
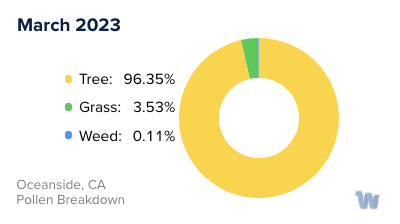
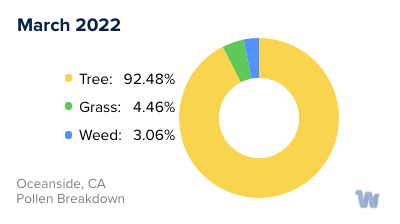
 0

Tree

When is tree pollen highest in Oceanside, CA?

March has the highest tree pollen in Oceanside, CA with an average PPM of 725.09

When is tree pollen lowest in Oceanside, CA?

August has the lowest tree pollen in Oceanside, CA with an average PPM of 55.67

Weed

When is weed pollen highest in Oceanside, CA?

November has the highest weed pollen in Oceanside, CA with an average PPM of 428.48

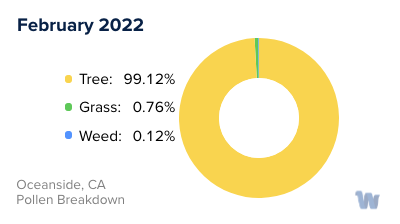
When is weed pollen lowest in Oceanside, CA?

February has the lowest weed pollen in Oceanside, CA with an average PPM of 0.34

Oceanside, CA Pollen Monthly Breakdown by Pollen Type

Oceanside, CA Monthly Pollen Breakdown

Pollen and Hay Fever in Oceanside, CA

Living in Oceanside, California, you're spoiled with stunning ocean views, beautiful weather, and a vibrant community. But there's another side to this coastal paradise, one that some residents know all too well - pollen allergies. Also known as hay fever, pollen allergies can make certain seasons of the year particularly challenging for those affected.

As an Oceanside resident, you may wonder what types of pollen are causing your sneezing, itchy eyes, and runny nose. Two primary types of pollen are common culprits: tree pollen and grass pollen.

Tree pollen is most prevalent in the spring, especially from February to May. Several species of trees are known to contribute to the pollen count in Oceanside. Among them are oak, cedar, pine, and olive trees. These trees release tiny, airborne pollen grains that can provoke hay fever symptoms in sensitive individuals.

Grass pollen, on the other hand, typically reaches its peak in late spring and early summer, usually from May to July. Common grasses in the Oceanside area that produce allergy-triggering pollen include Bermuda grass, ryegrass, and Kentucky bluegrass. Even though these grasses are more common in inland areas, coastal winds can easily carry their pollen to Oceanside.

While pollen allergies can be a nuisance, understanding what triggers your symptoms and when these allergens are most prevalent can help you better navigate your day-to-day life during pollen season. Remember, there's no need to let pollen allergies keep you from enjoying the natural beauty of Oceanside. With knowledge and a bit of planning, you can still enjoy the outdoors, even during peak pollen seasons.

Oceanside, CA Map

What is Wyndly?

Wyndly is the easiest and most convenient way to fix your allergies forever. As an online allergy practice, Wyndly offers at-home allergy testing and treatment. The main goal of Wyndly is to retrain the immune system to stop responding to allergens, providing lasting relief from allergies.

Here's how Wyndly works:

  1. Identify Allergy Triggers: The first step is to identify the allergy triggers. You can purchase an at-home allergy test from Wyndly, or if you have already done an allergy test elsewhere, you can share your existing test results. This allows the doctors at Wyndly to pinpoint which allergies need to be treated.
  2. Get Treated by a Real Doctor: Using medications that are similar to those used in allergy shots, a doctor creates a unique sublingual immunotherapy treatment plan to desensitize your immune system. This is done using FDA-approved sublingual tablets or clinically proven dosing for oral use.
  3. Live Better Without Symptoms: The prescriptions are shipped to your door, and the doctor works with you until you’re better. Wyndly offers regular online check-ins with US-licensed physicians and 24/7 availability for questions or concerns via text, email, or call.

The treatment plans are personalized based on your specific allergy triggers and aim to treat allergies at their source, rather than just relieving symptoms for a short period. Most people report improvement in as little as one month.

Start with Wyndly today

Wyndly Summer 2023 Pollen Report Methodology

For each city, Wyndly obtained monthly pollen PPMs (pollen grains per cubic meter) for each form (tree, grass, and weed) from February 2022 - May 2023. Data were obtained from Pollen Sense, LLC Automated Particulate Sensors (APS). These sensors automatically detect particulate matter collected from ambient air, and use a neural network algorithm to identify individual pollen species and calculate daily pollen counts.

Yearly averages are calculated by summing the three allergen averages per month of data for a total monthly PPM, summing all monthly total PPMs, then dividing by 12 (month count). Used for per-city average, state average, and total USA average. Season comparisons are done by summing the months of Spring (March, April, May) for 2023 and 2022. If the absolute of the (2023-2022)/2022 is ≤ 0.05, the years were about the same. Otherwise, the more PPM, the worse the season was.

Is Wyndly right for you?

Answer just a few questions and we'll help you find out.

Get Started Today

Pollen and Allergy Reports by City