Anaheim, CA Pollen and Allergy Report for Summer 2023

Pollen Allergy Trends in Anaheim, CA
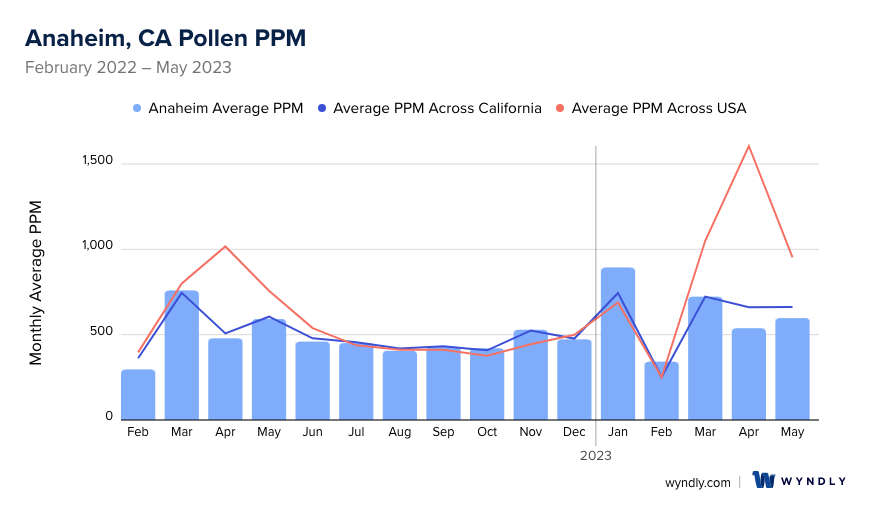
When is pollen lowest in Anaheim, CA?
February
Lowest month total PPM
Avg. PPM
When is pollen highest in Anaheim, CA?
January
Highest month total PPM
Avg. PPM
How does pollen in Anaheim, CA compare to California?
Anaheim has a lower average PPM than the state of California.
Anaheim yearly avg PPM:
California yearly avg PPM:
How does pollen in Anaheim, CA compare to the USA?
Anaheim has a lower average PPM than the USA.
Anaheim yearly avg PPM:
USA yearly avg PPM:
Is pollen worse this year in Anaheim, CA?
Spring 2023 was about the same as 2022.
Spring 2023 PPM:
Spring 2022 PPM:
Average PPM in Anaheim, CA
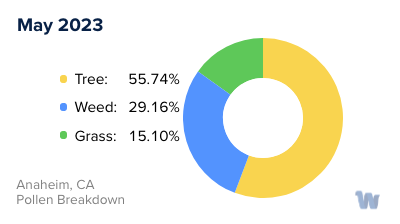
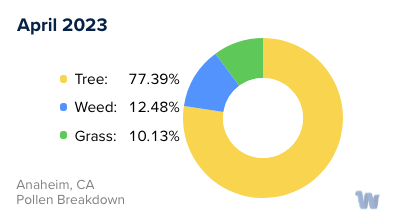
Anaheim, CA Pollen and Allergy Breakdown by Month
Grass
When is grass pollen highest in Anaheim, CA?
May has the highest grass pollen in Anaheim, CA with an average PPM of
When is grass pollen lowest in Anaheim, CA?
December has the lowest grass pollen in Anaheim, CA with an average PPM of
Tree
When is tree pollen highest in Anaheim, CA?
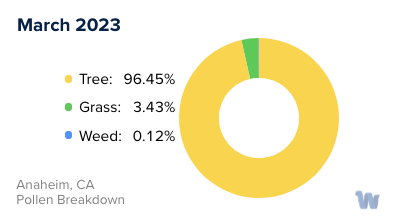
March has the highest tree pollen in Anaheim, CA with an average PPM of
When is tree pollen lowest in Anaheim, CA?
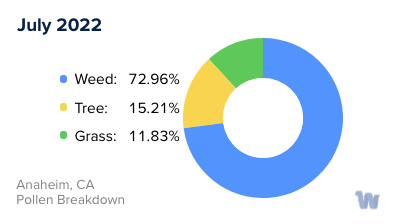
August has the lowest tree pollen in Anaheim, CA with an average PPM of
Weed
When is weed pollen highest in Anaheim, CA?
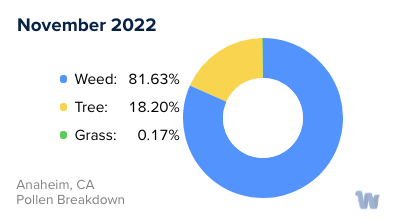
November has the highest weed pollen in Anaheim, CA with an average PPM of
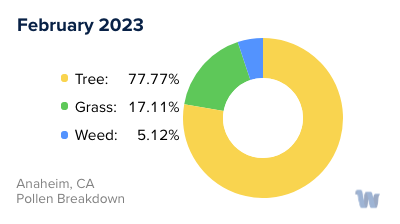
When is weed pollen lowest in Anaheim, CA?
February has the lowest weed pollen in Anaheim, CA with an average PPM of
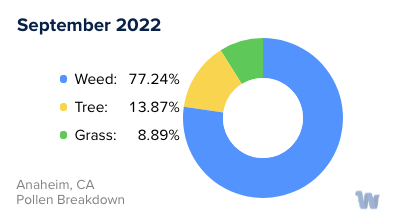
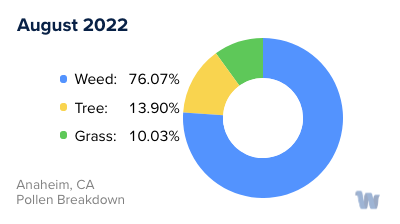
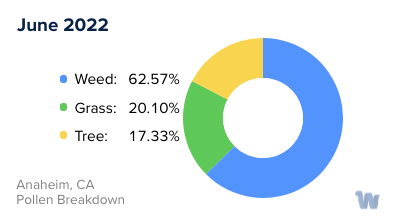
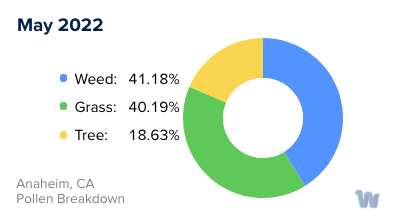
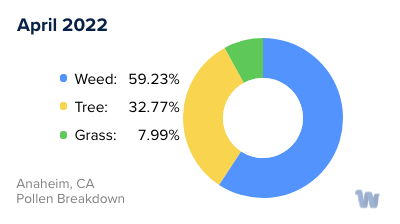
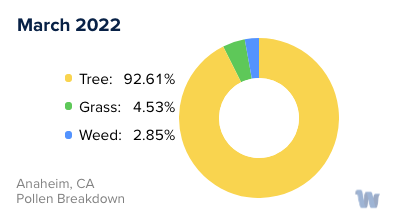
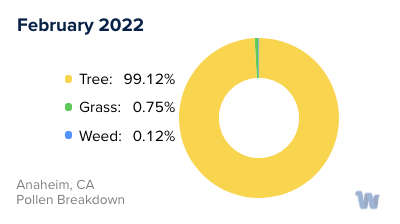
Anaheim, CA Pollen Monthly Breakdown by Pollen Type

Pollen and Hay Fever in Anaheim, CA
Living in the beautiful city of Anaheim, California, residents and visitors alike can enjoy an abundance of sunshine nearly all year round. This temperate climate, while a major draw, also supports the growth of various plants and trees that, unfortunately, contribute to a common nuisance: pollen allergies, also known as hay fever.
There are several types of pollen that people in Anaheim may find themselves particularly sensitive to. One primary offender is the oak tree pollen. Beautiful and abundant in this region, oak trees produce pollen typically in the spring, causing many residents to experience symptoms like sneezing, watery eyes, and nasal congestion.
Grasses, another type of allergen, are not to be overlooked. As Anaheim houses a wide range of grass species, including ryegrass, Bermuda grass, and Kentucky bluegrass, the city's expansive lawns and parks may inadvertently become hotbeds for allergy triggers during late spring and early summer. These grasses release tiny, lightweight pollen grains that can easily be swept up by the wind and inhaled, often inciting hay fever symptoms.
Ragweed pollen, though less common in Anaheim compared to other parts of the country, still exists and releases its pollen in late summer and fall. Even a single ragweed plant can produce up to one billion grains of pollen per season, and the particles can travel quite a distance on the wind, affecting those even without the plant in their immediate vicinity.
Lastly, it's worth mentioning that the Anaheim's moderate winter season can support the growth of certain molds, like Alternaria and Cladosporium. Although not a pollen, these molds release spores into the air which can act like pollen, causing similar allergic reactions in sensitive individuals.
In Anaheim, the potential for hay fever exists throughout the year due to the presence of these allergens across all seasons. Although the city offers a lot to appreciate, those who are sensitive should be mindful of the pollen and mold spore counts throughout the year.