Nashville, TN Pollen and Allergy Report for Summer 2023

Pollen Allergy Trends in Nashville, TN
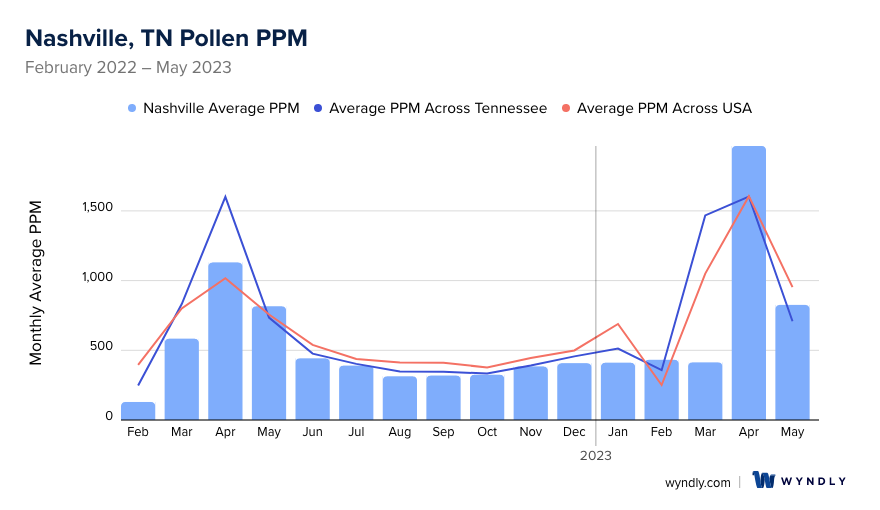
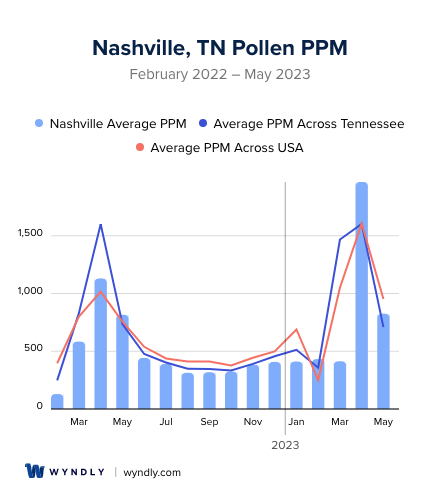
When is pollen lowest in Nashville, TN?
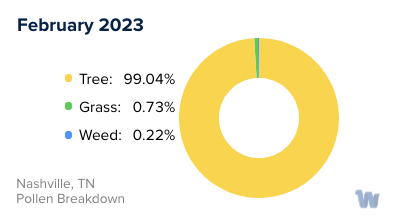
February
Lowest month total PPM
Avg. PPM
When is pollen highest in Nashville, TN?
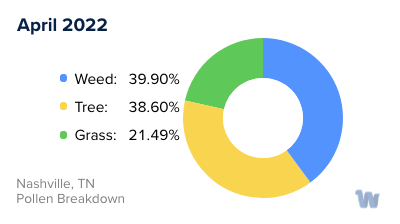
April
Highest month total PPM
Avg. PPM
How does pollen in Nashville, TN compare to Tennessee?
Nashville has a lower average PPM than the state of Tennessee.
Nashville yearly avg PPM:
Tennessee yearly avg PPM:
How does pollen in Nashville, TN compare to the USA?
Nashville has a lower average PPM than the USA.
Nashville yearly avg PPM:
USA yearly avg PPM:
Is pollen worse this year in Nashville, TN?
Spring 2023 was worse than spring 2022.
Spring 2023 PPM:
Spring 2022 PPM:
Average PPM in Nashville, TN
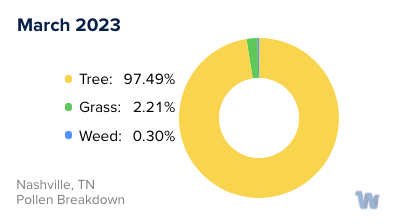
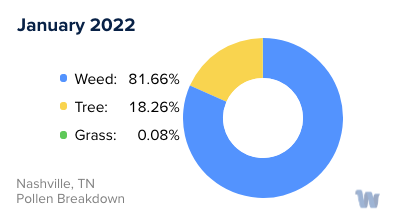
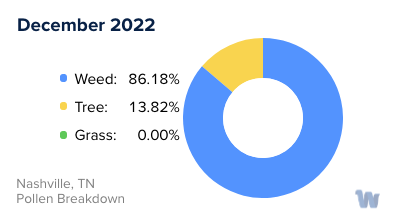
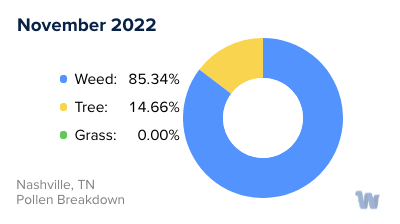
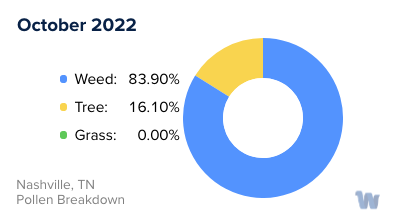
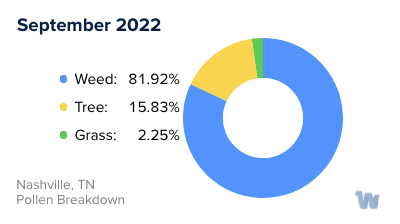
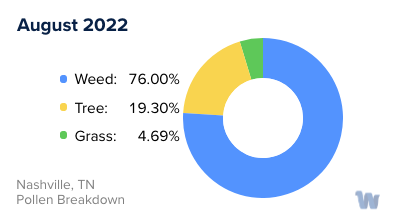
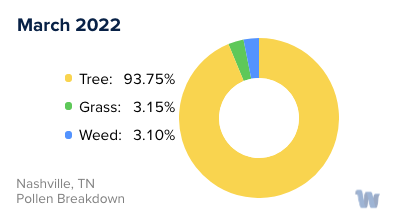
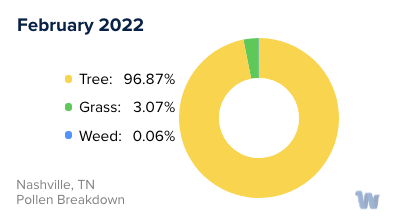
Nashville, TN Pollen and Allergy Breakdown by Month
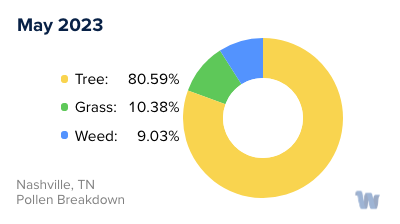
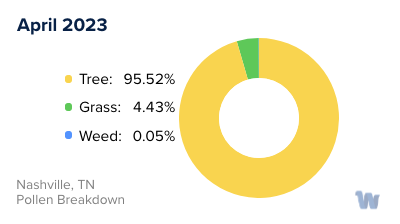
Grass
When is grass pollen highest in Nashville, TN?
April has the highest grass pollen in Nashville, TN with an average PPM of
When is grass pollen lowest in Nashville, TN?
October has the lowest grass pollen in Nashville, TN with an average PPM of
Tree
When is tree pollen highest in Nashville, TN?
April has the highest tree pollen in Nashville, TN with an average PPM of
When is tree pollen lowest in Nashville, TN?
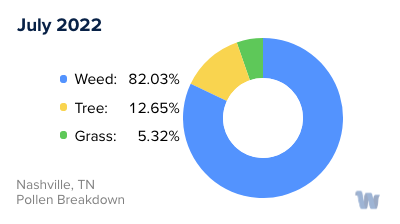
July has the lowest tree pollen in Nashville, TN with an average PPM of
Weed
When is weed pollen highest in Nashville, TN?
April has the highest weed pollen in Nashville, TN with an average PPM of
When is weed pollen lowest in Nashville, TN?
February has the lowest weed pollen in Nashville, TN with an average PPM of
Nashville, TN Pollen Monthly Breakdown by Pollen Type
Pollen and Hay Fever in Nashville, TN
Pollen allergies, often known as hay fever, can significantly impact the quality of life for those living in Nashville, Tennessee. For these individuals, understanding the types of pollen present and the varying seasons can provide valuable insight into managing daily activities.
Nashville, with its diverse flora, is home to a variety of pollens that can trigger allergies. The primary types of pollen causing hay fever in this city can be divided into three categories: tree, grass, and weed.
Tree pollen is prevalent in the spring. Oaks, cedars, pines, and hickories are abundant in Nashville and are notorious for their high pollen production. As winter retreats and these trees begin to bloom, they release microscopic pollen grains into the air. These particles are lightweight and easily carried by the wind, leading to a widespread distribution that can be particularly bothersome for allergy sufferers.
As we transition into late spring and early summer, grass pollen takes center stage. Common grasses in Nashville include Bermuda grass, Kentucky bluegrass, and ryegrass. Their pollen is released during their flowering period, turning the otherwise enjoyable warm weather into a challenging time for those with grass pollen allergies.
Finally, as summer fades into fall, weed pollen becomes the primary concern. Ragweed is a significant contributor to hay fever in Nashville, with each plant capable of producing up to a billion pollen grains per season. Other weeds like sagebrush, lamb's quarters, and pigweed also contribute to the allergy landscape in the city.
It's important to remember that although these pollen types typically peak during specific seasons, weather conditions can influence pollen counts. Unusually warm or windy days might cause higher pollen levels, while rain can help to clear the air.
Being mindful of the types of pollen and their respective seasons in Nashville can help individuals prepare for and navigate the pollen allergy season, ultimately leading to a better understanding of their environment and their personal wellbeing.