Buffalo, NY Pollen and Allergy Report for Summer 2023

Pollen Allergy Trends in Buffalo, NY

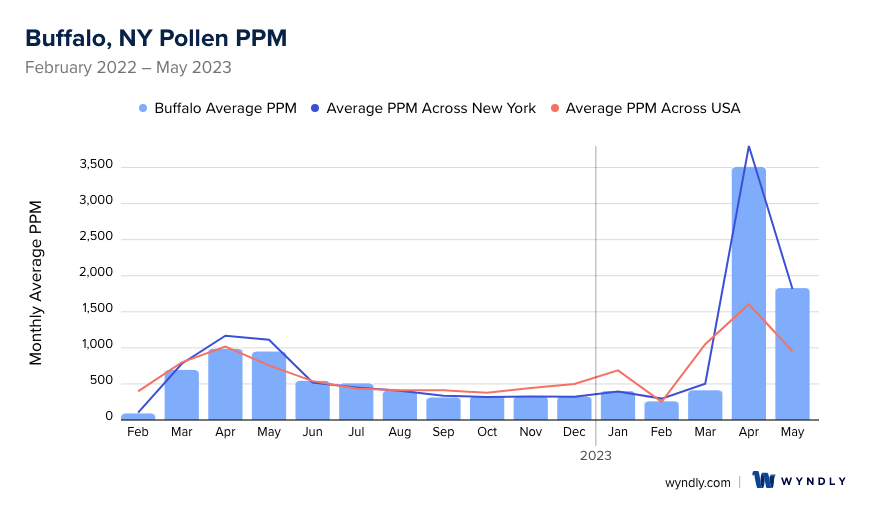
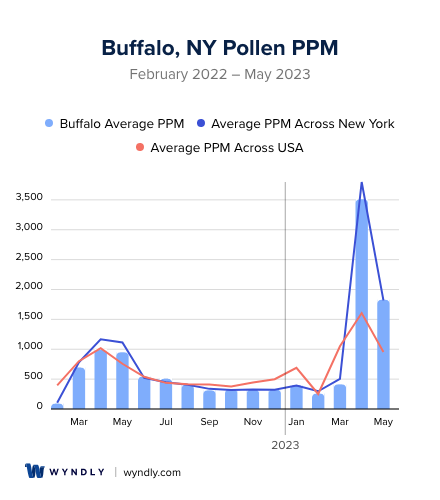
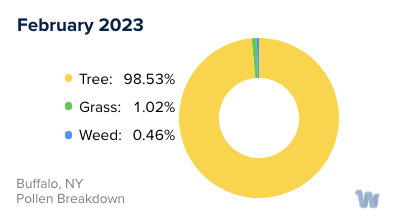
When is pollen lowest in Buffalo, NY?

Green down arrow

February

Lowest month total PPM

91.49 Avg. PPM

When is pollen highest in Buffalo, NY?

Red up arrow

April

Highest month total PPM

3,509.26 Avg. PPM

How does pollen in Buffalo, NY compare to New York?

Buffalo has a lower average PPM than the state of New York.

Buffalo yearly avg PPM: 742.87

New York yearly avg PPM: 790.88

How does pollen in Buffalo, NY compare to the USA?

Buffalo has a higher average PPM than the USA.

Buffalo yearly avg PPM: 742.87

USA yearly avg PPM: 664.86

Is pollen worse this year in Buffalo, NY?

Spring 2023 was worse than spring 2022.

Spring 2023 PPM: 5,750.03

Spring 2022 PPM: 2,630.93

Average PPM in Buffalo, NY

Buffalo, NY Average PPM Buffalo, NY Average PPM

Buffalo, NY Pollen and Allergy Breakdown by Month

Grass

When is grass pollen highest in Buffalo, NY?

April has the highest grass pollen in Buffalo, NY with an average PPM of 243.05

When is grass pollen lowest in Buffalo, NY?

December has the lowest grass pollen in Buffalo, NY with an average PPM of 0

Tree

When is tree pollen highest in Buffalo, NY?

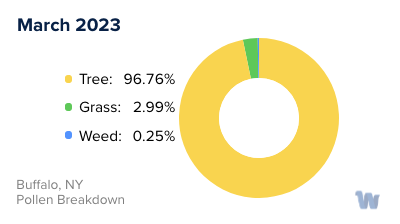
April has the highest tree pollen in Buffalo, NY with an average PPM of 3,143.87

When is tree pollen lowest in Buffalo, NY?

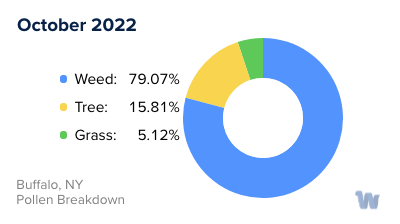
October has the lowest tree pollen in Buffalo, NY with an average PPM of 52.48

Weed

When is weed pollen highest in Buffalo, NY?

April has the highest weed pollen in Buffalo, NY with an average PPM of 455.42

When is weed pollen lowest in Buffalo, NY?

February has the lowest weed pollen in Buffalo, NY with an average PPM of 0.07

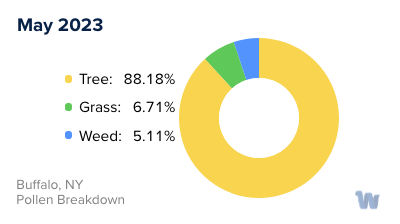
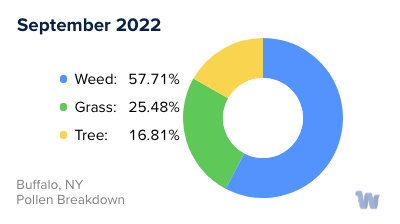
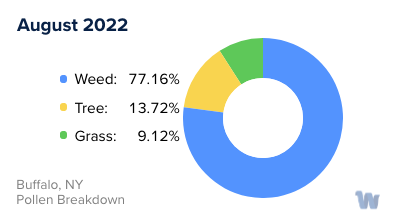
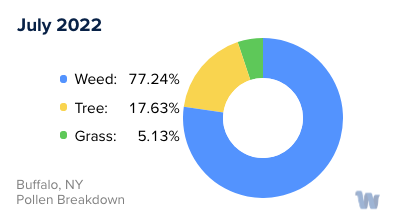
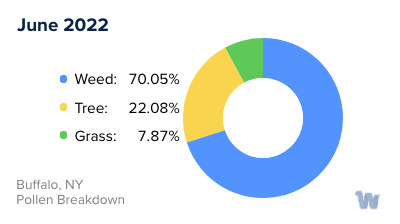
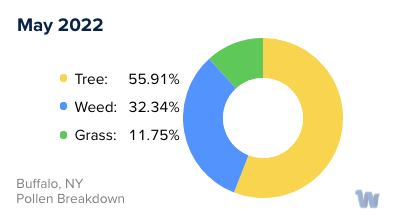
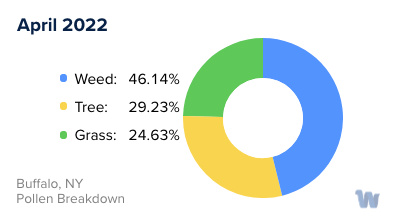
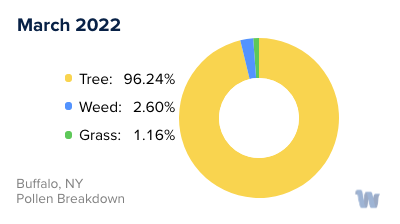
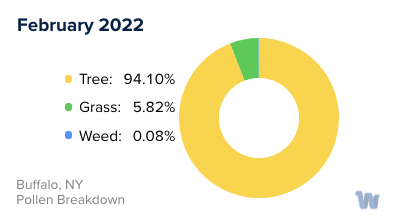
Buffalo, NY Pollen Monthly Breakdown by Pollen Type

Buffalo, NY Monthly Pollen Breakdown

Pollen and Hay Fever in Buffalo, NY

For residents of Buffalo, New York, the blossoming of spring and the warmth of summer are often accompanied by the less welcome arrival of seasonal allergies, commonly referred to as hay fever. This condition, triggered by airborne pollen, can cause a multitude of symptoms, such as sneezing, runny nose, and itchy eyes. Understanding the types of pollen present and their respective seasons can help individuals prepare for and manage their allergy symptoms.

In Buffalo, tree pollen makes its presence known first, with May considered the peak season for this type of pollen. This is when trees such as oak, pine, and birch release their pollen, blanketing the city in microscopic particles that can set off allergic reactions.

As tree pollen levels start to taper off, grass pollen takes over. June is the grass pollen season in Buffalo, with grasses such as Timothy, Kentucky bluegrass, and ryegrass releasing their pollen. This shift from tree to grass pollen means there's little respite for allergy sufferers as the seasons change.

Finally, in mid-August, ragweed pollen becomes the main allergen. Despite its unassuming appearance, ragweed is a major cause of hay fever symptoms, with a single plant capable of producing up to a billion grains of pollen per season.

Therefore, for a large part of the year, from spring to late summer, residents of Buffalo face a rotating roster of airborne allergens. It's important to note that while this guide provides a general timeline, actual pollen levels can vary from year to year, and even day to day, due to factors such as weather and temperature. Despite these challenges, understanding the types of pollen and their seasons can provide a foundation for effectively managing seasonal allergies.

Buffalo, NY Map

What is Wyndly?

Wyndly is the easiest and most convenient way to fix your allergies forever. As an online allergy practice, Wyndly offers at-home allergy testing and treatment. The main goal of Wyndly is to retrain the immune system to stop responding to allergens, providing lasting relief from allergies.

Here's how Wyndly works:

  1. Identify Allergy Triggers: The first step is to identify the allergy triggers. You can purchase an at-home allergy test from Wyndly, or if you have already done an allergy test elsewhere, you can share your existing test results. This allows the doctors at Wyndly to pinpoint which allergies need to be treated.
  2. Get Treated by a Real Doctor: Using medications that are similar to those used in allergy shots, a doctor creates a unique sublingual immunotherapy treatment plan to desensitize your immune system. This is done using FDA-approved sublingual tablets or clinically proven dosing for oral use.
  3. Live Better Without Symptoms: The prescriptions are shipped to your door, and the doctor works with you until you’re better. Wyndly offers regular online check-ins with US-licensed physicians and 24/7 availability for questions or concerns via text, email, or call.

The treatment plans are personalized based on your specific allergy triggers and aim to treat allergies at their source, rather than just relieving symptoms for a short period. Most people report improvement in as little as one month.

Start with Wyndly today

Wyndly Summer 2023 Pollen Report Methodology

For each city, Wyndly obtained monthly pollen PPMs (pollen grains per cubic meter) for each form (tree, grass, and weed) from February 2022 - May 2023. Data were obtained from Pollen Sense, LLC Automated Particulate Sensors (APS). These sensors automatically detect particulate matter collected from ambient air, and use a neural network algorithm to identify individual pollen species and calculate daily pollen counts.

Yearly averages are calculated by summing the three allergen averages per month of data for a total monthly PPM, summing all monthly total PPMs, then dividing by 12 (month count). Used for per-city average, state average, and total USA average. Season comparisons are done by summing the months of Spring (March, April, May) for 2023 and 2022. If the absolute of the (2023-2022)/2022 is ≤ 0.05, the years were about the same. Otherwise, the more PPM, the worse the season was.

Is Wyndly right for you?

Answer just a few questions and we'll help you find out.

Get Started Today

Pollen and Allergy Reports by City