Gresham, OR Pollen and Allergy Report for Summer 2023

Pollen Allergy Trends in Gresham, OR
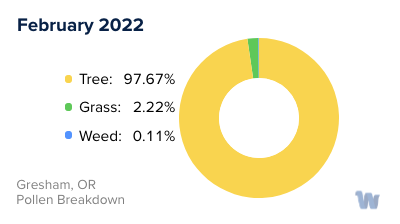
When is pollen lowest in Gresham, OR?
February
Lowest month total PPM
Avg. PPM
When is pollen highest in Gresham, OR?
April
Highest month total PPM
Avg. PPM
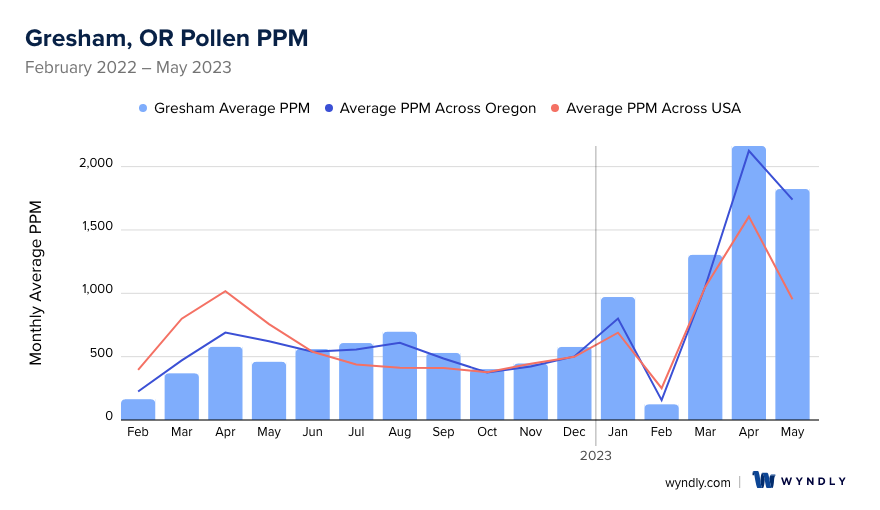
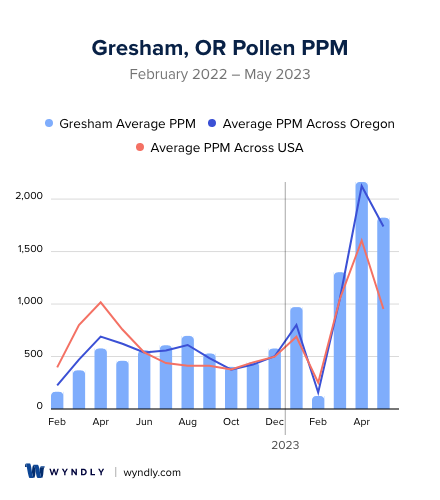
How does pollen in Gresham, OR compare to Oregon?
Gresham has a higher average PPM than the state of Oregon.
Gresham yearly avg PPM:
Oregon yearly avg PPM:
How does pollen in Gresham, OR compare to the USA?
Gresham has a higher average PPM than the USA.
Gresham yearly avg PPM:
USA yearly avg PPM:
Is pollen worse this year in Gresham, OR?
Spring 2023 was worse than spring 2022.
Spring 2023 PPM:
Spring 2022 PPM:
Average PPM in Gresham, OR
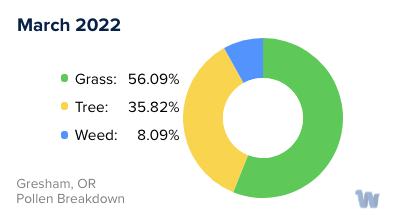
Gresham, OR Pollen and Allergy Breakdown by Month
Grass
When is grass pollen highest in Gresham, OR?
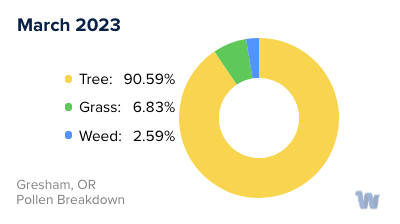
March has the highest grass pollen in Gresham, OR with an average PPM of
When is grass pollen lowest in Gresham, OR?
December has the lowest grass pollen in Gresham, OR with an average PPM of
Tree
When is tree pollen highest in Gresham, OR?
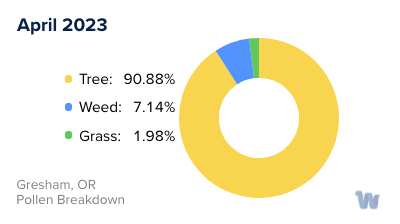
April has the highest tree pollen in Gresham, OR with an average PPM of
When is tree pollen lowest in Gresham, OR?
April has the lowest tree pollen in Gresham, OR with an average PPM of
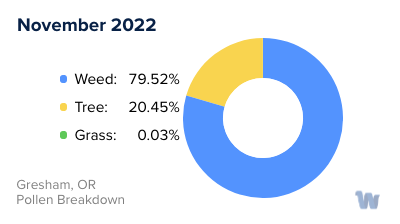
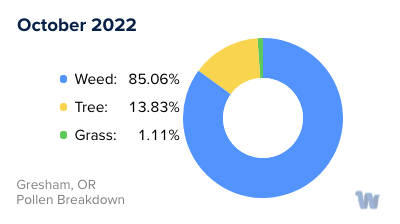
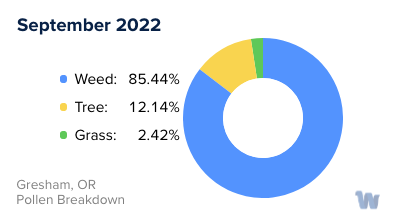
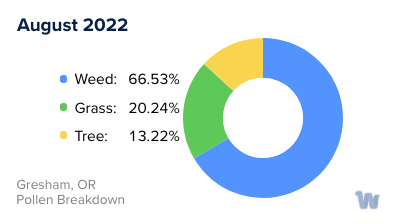
Weed
When is weed pollen highest in Gresham, OR?
August has the highest weed pollen in Gresham, OR with an average PPM of
When is weed pollen lowest in Gresham, OR?
February has the lowest weed pollen in Gresham, OR with an average PPM of
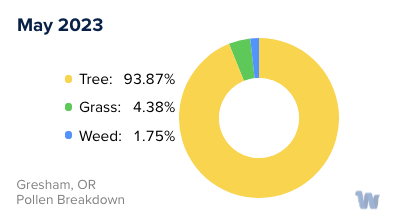
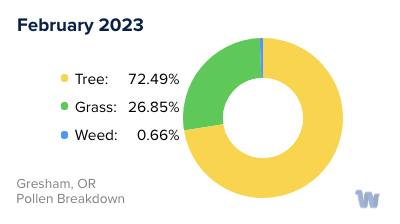
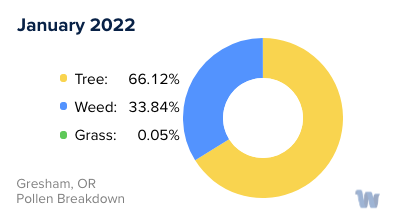
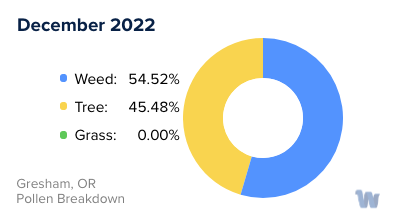
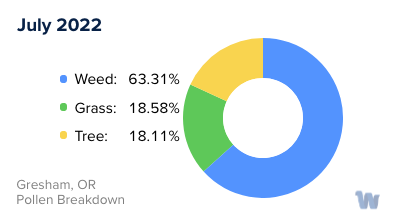
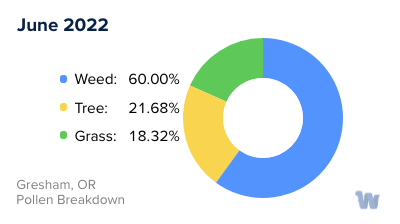
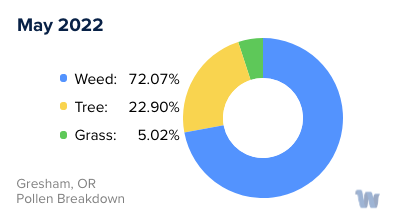
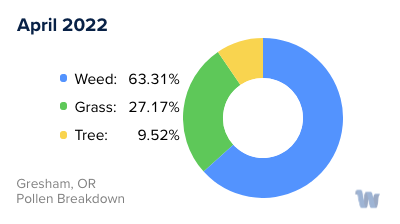
Gresham, OR Pollen Monthly Breakdown by Pollen Type
Pollen and Hay Fever in Gresham, OR
Gresham, Oregon, nestled in the scenic Pacific Northwest, is a vibrant city that offers a bounty of natural beauty. However, its mild, wet climate also provides the perfect environment for a range of plants to flourish, leading to a high concentration of pollen in the air. For those affected by seasonal allergies, this can result in uncomfortable symptoms throughout much of the year.
The city sees a variety of pollen types, primarily from grasses, trees, and weeds. Each of these contributes to the pollen count, a measure of the pollen density in the air. For instance, on a typical day in Gresham, you might find the pollen count to be around 166 grains per cubic meter of air.
The concentration of each type of pollen varies throughout the year, corresponding with the plants' individual growth cycles. In Gresham, as in the rest of Oregon, the winter and spring months are typically dominated by tree pollen. As the weather warms and summer sets in, grass pollen takes center stage. By the time fall arrives, it is the pollen from weeds that is most likely to cause allergies.
The allergy season in Gresham often begins as early as December, thanks to Oregon's mild climate and winters. This extended season, which is longer than in most other states, peaks during March, April, June, and September. During these months, it's common to see an uptick in the number of individuals dealing with sneezing, runny noses, and watery eyes.
Unfortunately, there is little respite for allergy sufferers in this part of the world, as the season typically extends until late November. This almost year-round allergy period, combined with both outdoor and indoor allergens, can make life a little challenging for those susceptible to these conditions.
In conclusion, while Gresham, Oregon is undoubtedly a beautiful place to live, its residents need to be aware of the pollen types and seasons to best navigate the prolonged allergy season. By understanding these patterns, individuals can better anticipate and manage their seasonal allergies.