Ontario, CA Pollen and Allergy Report for Summer 2023

Pollen Allergy Trends in Ontario, CA
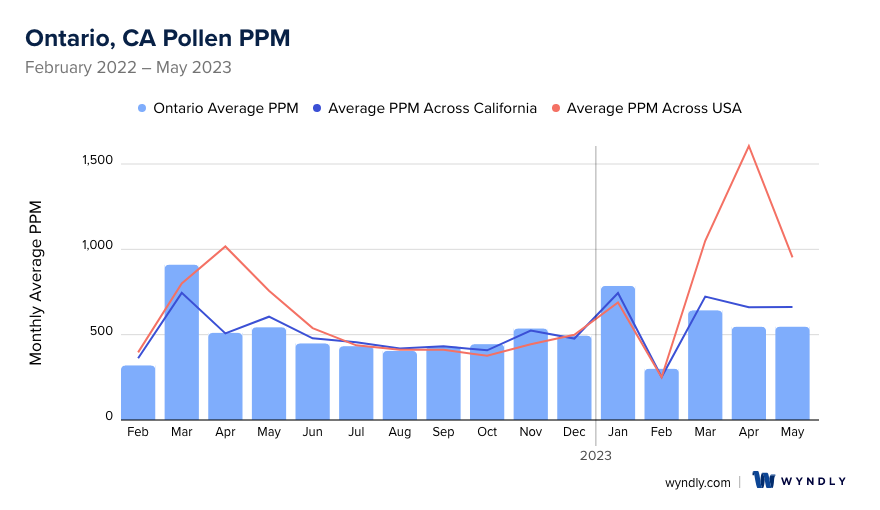
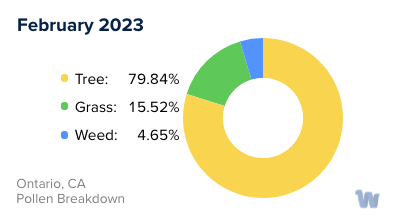
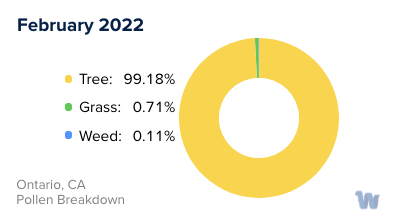
When is pollen lowest in Ontario, CA?
February
Lowest month total PPM
Avg. PPM
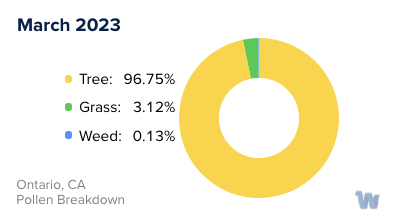
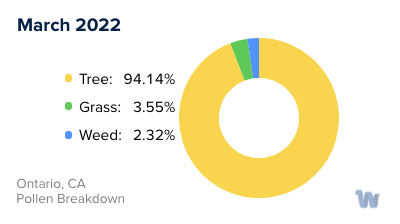
When is pollen highest in Ontario, CA?
March
Highest month total PPM
Avg. PPM
How does pollen in Ontario, CA compare to California?
Ontario has a lower average PPM than the state of California.
Ontario yearly avg PPM:
California yearly avg PPM:
How does pollen in Ontario, CA compare to the USA?
Ontario has a lower average PPM than the USA.
Ontario yearly avg PPM:
USA yearly avg PPM:
Is pollen worse this year in Ontario, CA?
Spring 2023 was better than spring 2022.
Spring 2023 PPM:
Spring 2022 PPM:
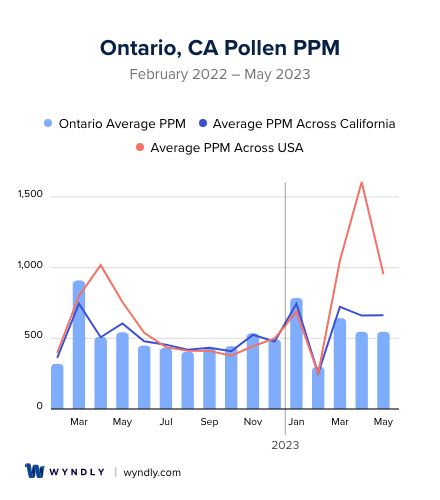
Average PPM in Ontario, CA
Ontario, CA Pollen and Allergy Breakdown by Month
Grass
When is grass pollen highest in Ontario, CA?
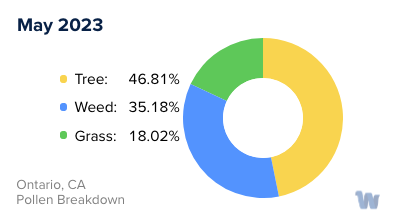
May has the highest grass pollen in Ontario, CA with an average PPM of
When is grass pollen lowest in Ontario, CA?
December has the lowest grass pollen in Ontario, CA with an average PPM of
Tree
When is tree pollen highest in Ontario, CA?
March has the highest tree pollen in Ontario, CA with an average PPM of
When is tree pollen lowest in Ontario, CA?
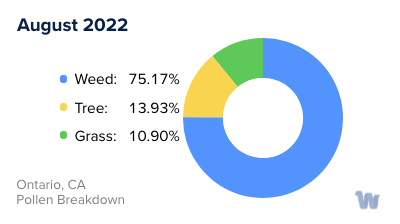
August has the lowest tree pollen in Ontario, CA with an average PPM of
Weed
When is weed pollen highest in Ontario, CA?
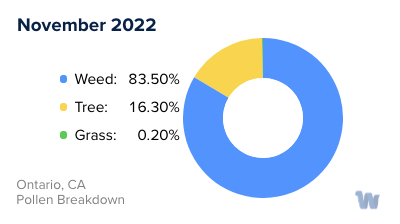
November has the highest weed pollen in Ontario, CA with an average PPM of
When is weed pollen lowest in Ontario, CA?
February has the lowest weed pollen in Ontario, CA with an average PPM of
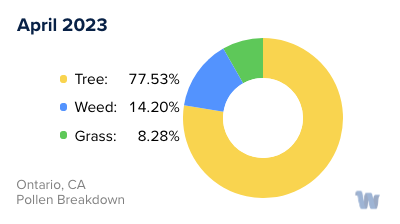
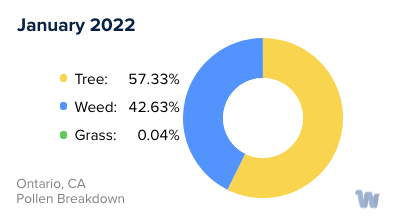
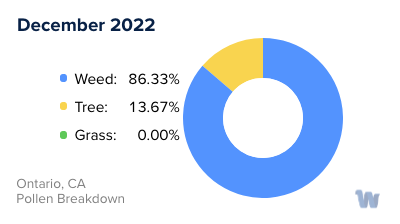
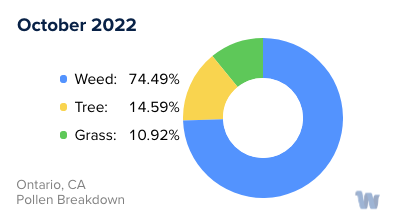
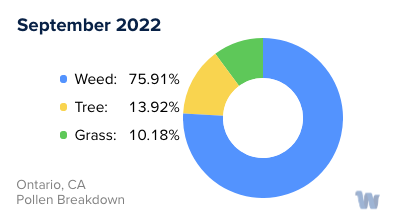
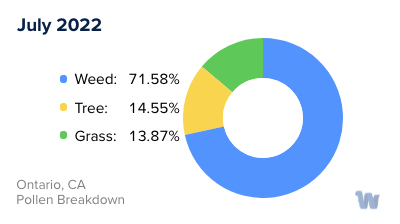
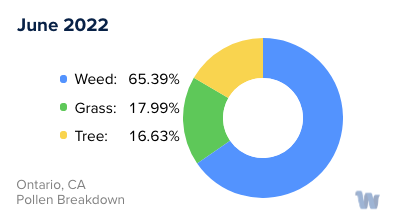
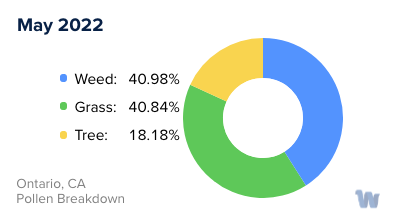
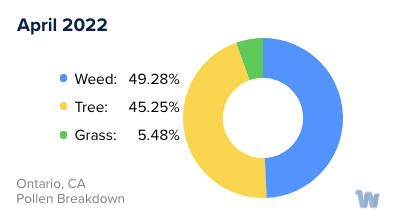
Ontario, CA Pollen Monthly Breakdown by Pollen Type
Pollen and Hay Fever in Ontario, CA
In the vibrant city of Ontario, California, with its bountiful parks and tree-lined neighborhoods, residents often find themselves grappling with a common yet often overlooked health issue: pollen allergies, also known as hay fever. These allergies are caused by pollen, a fine powder released by plants as part of their reproductive cycle. In Ontario, this can be a particular challenge given the city's diverse flora and the varying pollination seasons of different plant species.
Pollen allergies in Ontario are mainly triggered by three types of plants: trees, grasses, and weeds. Each plant type has its unique pollination period, contributing to a prolonged allergy season for the city's residents.
Tree pollen is typically the first to make its appearance, with its season stretching from late winter to early spring. The most common culprits in Ontario are oak, pine, and cedar trees. Their pollen is released into the air and can travel for miles, causing sneezing, itchy eyes, and runny noses for those sensitive to it.
Following tree pollen, grass pollen takes center stage from late spring to early summer. Bermuda grass, ryegrass, and Kentucky bluegrass are among the most common grasses in Ontario and are known for their high pollen production. They release their pollen into the warm air, causing a second wave of allergy symptoms for many residents.
Finally, as summer transitions into fall, weed pollen comes to the fore. The main offenders in Ontario include ragweed, sagebrush, and lamb's quarters. These hardy plants can survive in a variety of conditions and produce copious amounts of pollen, leading to a late-season surge in hay fever symptoms.
While Ontario's diverse plant life and moderate climate make it a beautiful place to live, they also contribute to a lengthy pollen season. By understanding the types of pollen and their respective seasons, residents can better anticipate and navigate the challenges of pollen allergies, enhancing their ability to enjoy the city's natural beauty.