Fairfield, CA Pollen and Allergy Report for Summer 2023

Pollen Allergy Trends in Fairfield, CA
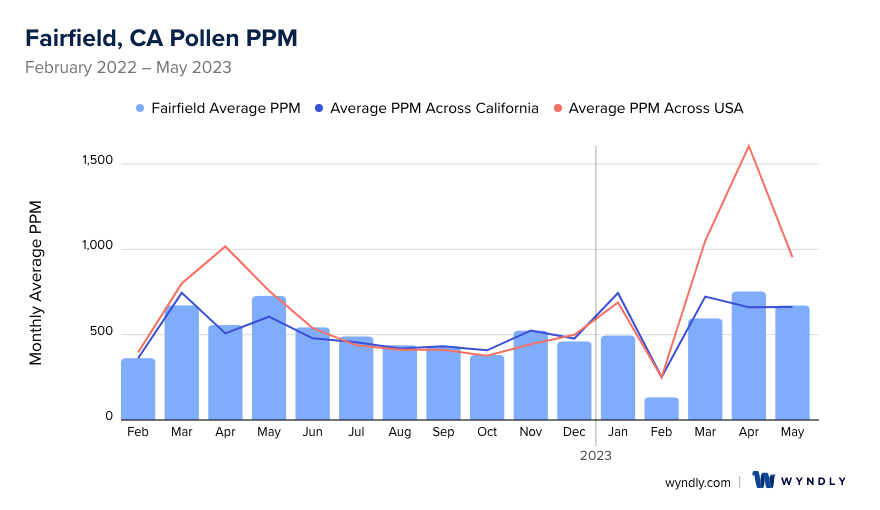
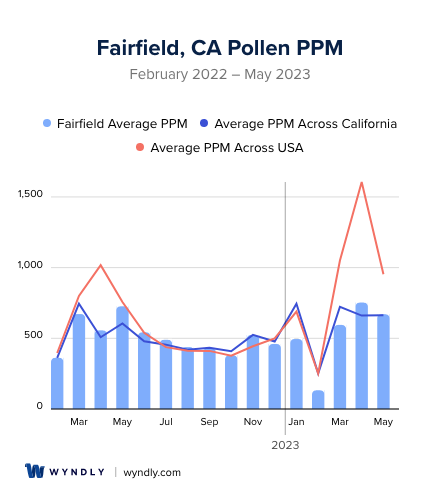
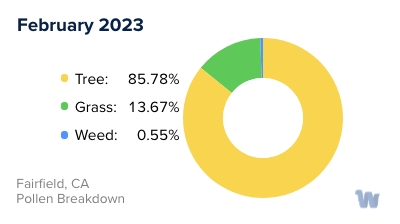
When is pollen lowest in Fairfield, CA?
February
Lowest month total PPM
Avg. PPM
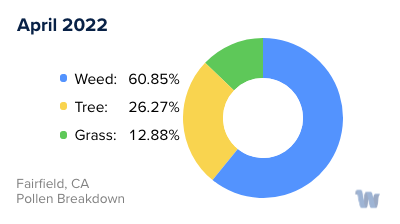
When is pollen highest in Fairfield, CA?
April
Highest month total PPM
Avg. PPM
How does pollen in Fairfield, CA compare to California?
Fairfield has a lower average PPM than the state of California.
Fairfield yearly avg PPM:
California yearly avg PPM:
How does pollen in Fairfield, CA compare to the USA?
Fairfield has a lower average PPM than the USA.
Fairfield yearly avg PPM:
USA yearly avg PPM:
Is pollen worse this year in Fairfield, CA?
Spring 2023 was about the same as 2022.
Spring 2023 PPM:
Spring 2022 PPM:
Average PPM in Fairfield, CA
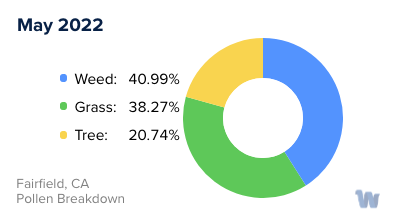
Fairfield, CA Pollen and Allergy Breakdown by Month
Grass
When is grass pollen highest in Fairfield, CA?
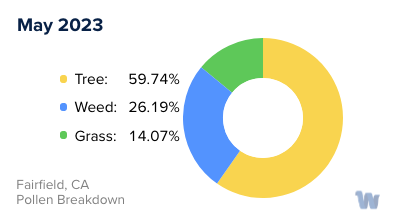
May has the highest grass pollen in Fairfield, CA with an average PPM of
When is grass pollen lowest in Fairfield, CA?
December has the lowest grass pollen in Fairfield, CA with an average PPM of
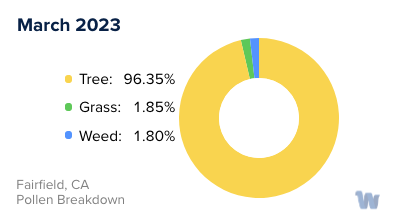
Tree
When is tree pollen highest in Fairfield, CA?
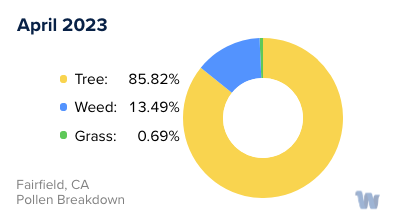
April has the highest tree pollen in Fairfield, CA with an average PPM of
When is tree pollen lowest in Fairfield, CA?
August has the lowest tree pollen in Fairfield, CA with an average PPM of
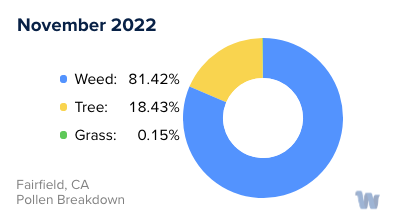
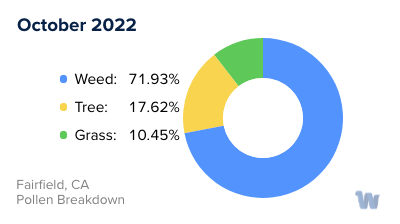
Weed
When is weed pollen highest in Fairfield, CA?
November has the highest weed pollen in Fairfield, CA with an average PPM of
When is weed pollen lowest in Fairfield, CA?
February has the lowest weed pollen in Fairfield, CA with an average PPM of
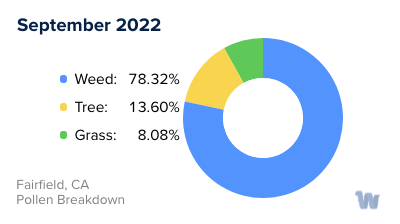
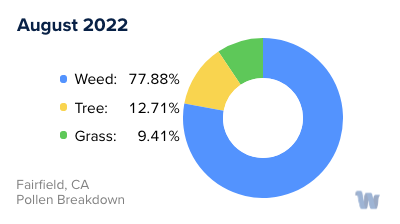
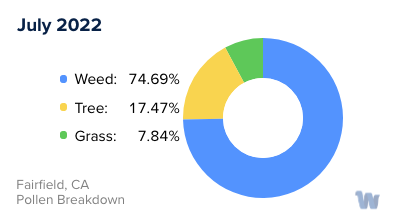
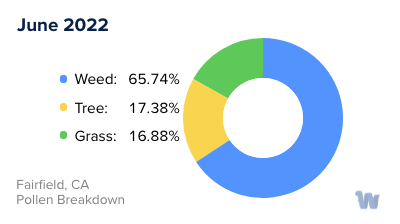
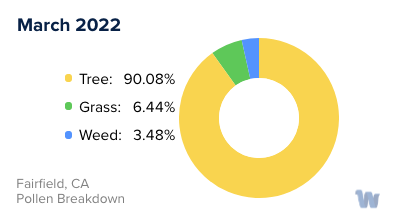
Fairfield, CA Pollen Monthly Breakdown by Pollen Type


Pollen and Hay Fever in Fairfield, CA
Pollen allergies, often referred to as hay fever, are quite common in Fairfield, California, and can cause a myriad of symptoms such as sneezing, itchy eyes, and runny nose. Fairfield, nestled in the heart of the Solano County, experiences a variety of plant life, leading to a spectrum of pollen types that can trigger these allergies.
Oak trees are a common sight in Fairfield, with their pollen levels peaking in the spring months. This can lead to an uptick in allergy symptoms for residents during this season. Grass pollen, particularly from ryegrass and Bermuda grass, is another prevalent allergen in this area. Grass pollen season typically spans from late spring to early summer, often overlapping with the oak pollen season, making this period challenging for individuals with pollen allergies.
Furthermore, late summer to early fall sees a surge in weed pollen, specifically from plants like ragweed, sagebrush, and nettle. These plants are native to California, and their pollen can travel long distances, affecting even those who live further away from the source.
The diversity of the plant life in Fairfield means that different types of pollen are present throughout various seasons of the year. This continuous cycle of pollen release can make Fairfield a challenging place to live for those susceptible to hay fever. However, understanding the types of pollen and their respective seasons can be incredibly helpful. It allows individuals to anticipate and prepare for the times when their symptoms might be exacerbated, enabling them to better manage their day-to-day activities.
While the beautiful, natural environment of Fairfield is a joy to behold, it's worth noting that its vibrant plant life contributes to a range of pollen allergies. For those living with hay fever, awareness of the local pollen calendar can be an important first step to navigating life with allergies in Fairfield, California.