Evanston, IL Pollen and Allergy Report for Summer 2023

Pollen Allergy Trends in Evanston, IL

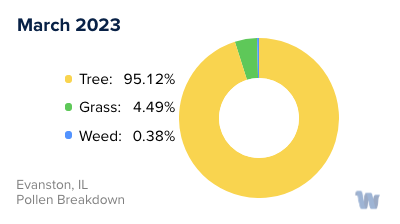
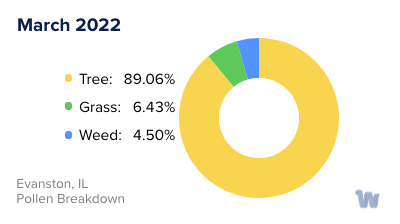
When is pollen lowest in Evanston, IL?

Green down arrow

March

Lowest month total PPM

224.14 Avg. PPM

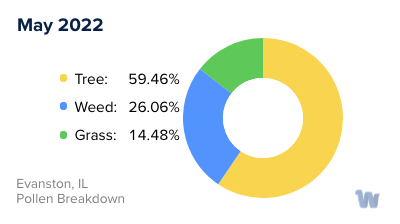
When is pollen highest in Evanston, IL?
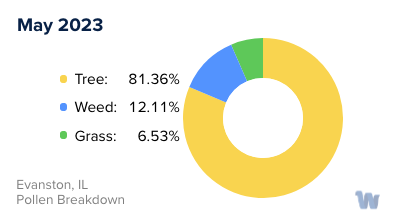
Red up arrow

May

Highest month total PPM

2,585.07 Avg. PPM

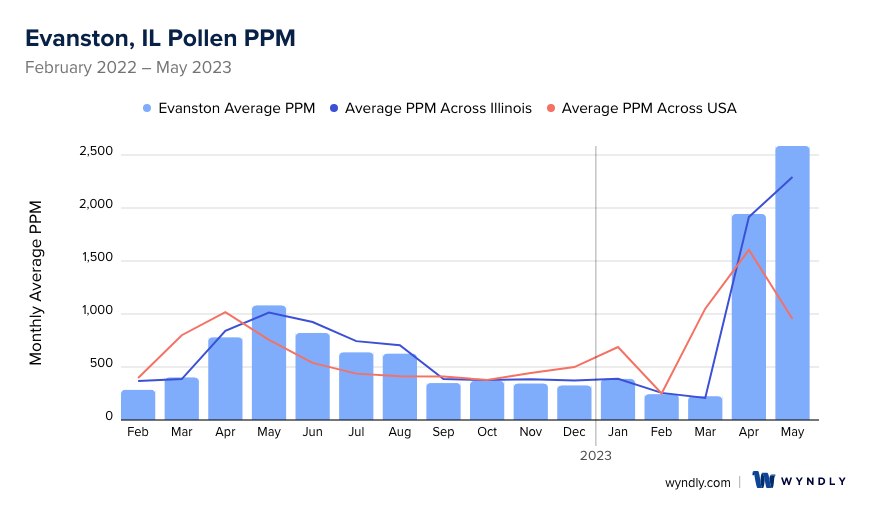
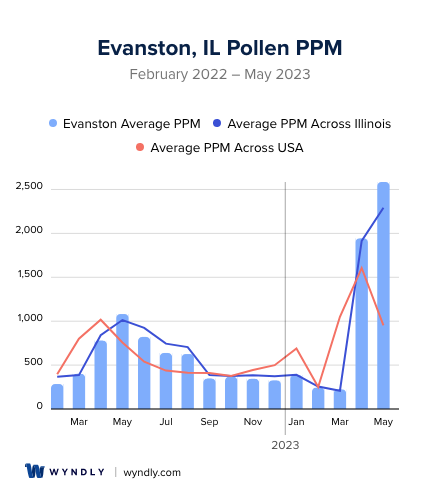
How does pollen in Evanston, IL compare to Illinois?

Evanston has a lower average PPM than the state of Illinois.

Evanston yearly avg PPM: 712.7

Illinois yearly avg PPM: 722.38

How does pollen in Evanston, IL compare to the USA?

Evanston has a higher average PPM than the USA.

Evanston yearly avg PPM: 712.7

USA yearly avg PPM: 664.86

Is pollen worse this year in Evanston, IL?

Spring 2023 was worse than spring 2022.

Spring 2023 PPM: 4,752.98

Spring 2022 PPM: 2,262.77

Average PPM in Evanston, IL

Evanston, IL Average PPM Evanston, IL Average PPM

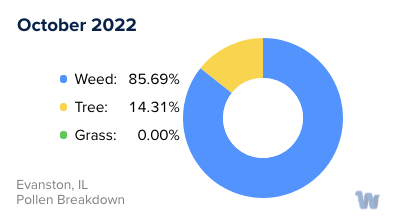
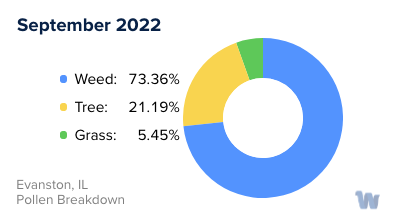
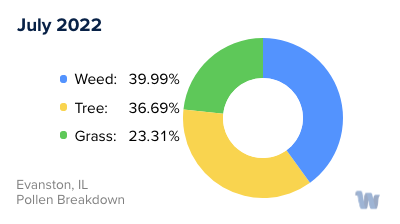
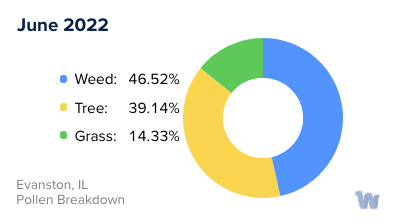
Evanston, IL Pollen and Allergy Breakdown by Month

Grass

When is grass pollen highest in Evanston, IL?

May has the highest grass pollen in Evanston, IL with an average PPM of 168.73

When is grass pollen lowest in Evanston, IL?

October has the lowest grass pollen in Evanston, IL with an average PPM of 0

Tree

When is tree pollen highest in Evanston, IL?

May has the highest tree pollen in Evanston, IL with an average PPM of 2,103.16

When is tree pollen lowest in Evanston, IL?

October has the lowest tree pollen in Evanston, IL with an average PPM of 52.7

Weed

When is weed pollen highest in Evanston, IL?

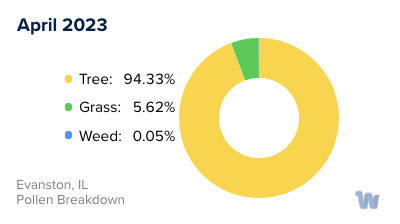
April has the highest weed pollen in Evanston, IL with an average PPM of 464.63

When is weed pollen lowest in Evanston, IL?

February has the lowest weed pollen in Evanston, IL with an average PPM of 0.07

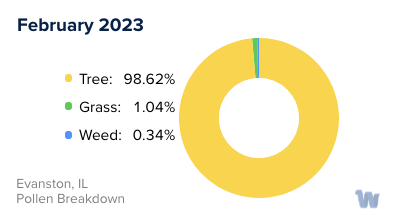
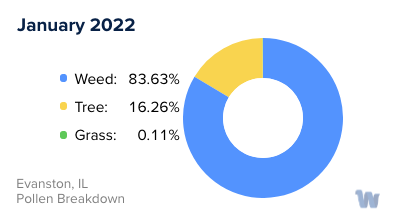
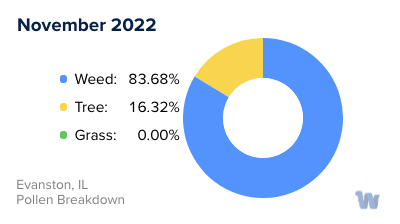
Evanston, IL Pollen Monthly Breakdown by Pollen Type

Evanston, IL Monthly Pollen Breakdown

Pollen and Hay Fever in Evanston, IL

When it comes to pollen allergies, Evanston, Illinois, experiences a typical seasonal cycle. The allergy season begins around March, as the arrival of spring triggers the release of tree pollen into the air. Key culprits include oak, hickory, maple, ash, willow, privet, mulberry, and walnut trees, making spring a challenging time for individuals sensitive to these types of pollen.

As summer rolls in around mid-May, the primary allergens shift from tree pollen to grass pollen. For residents of Evanston, various grasses such as ryegrass, Bermuda, bent, timothy, brome, sweet vernal, fescue, orchard, and prairie grasses can cause allergic reactions. The grass pollen season typically tapers off by August, providing some respite for those affected.

However, the relief is temporary, as the arrival of fall in August brings another wave of allergens. This time, weed pollen takes center stage. Common triggers include ragweed, wormwood, sagebrush, orache, pigweed, and amaranth. The weed pollen season continues until the first hard freeze of winter, marking the end of the allergy season.

Winter in Evanston is typically free of pollen allergies thanks to the very cold temperatures. However, it's essential to note that while outdoor allergens might be absent, indoor allergens can still cause issues.

In summary, Evanston, like many other parts of Illinois, experiences a cycle of different allergens throughout the year. Tree pollen is prevalent in the spring, grass pollen in the summer, and weed pollen in the fall. Each of these seasons brings its unique challenges to those susceptible to these allergens.

Evanston, IL Map

What is Wyndly?

Wyndly is the easiest and most convenient way to fix your allergies forever. As an online allergy practice, Wyndly offers at-home allergy testing and treatment. The main goal of Wyndly is to retrain the immune system to stop responding to allergens, providing lasting relief from allergies.

Here's how Wyndly works:

  1. Identify Allergy Triggers: The first step is to identify the allergy triggers. You can purchase an at-home allergy test from Wyndly, or if you have already done an allergy test elsewhere, you can share your existing test results. This allows the doctors at Wyndly to pinpoint which allergies need to be treated.
  2. Get Treated by a Real Doctor: Using medications that are similar to those used in allergy shots, a doctor creates a unique sublingual immunotherapy treatment plan to desensitize your immune system. This is done using FDA-approved sublingual tablets or clinically proven dosing for oral use.
  3. Live Better Without Symptoms: The prescriptions are shipped to your door, and the doctor works with you until you’re better. Wyndly offers regular online check-ins with US-licensed physicians and 24/7 availability for questions or concerns via text, email, or call.

The treatment plans are personalized based on your specific allergy triggers and aim to treat allergies at their source, rather than just relieving symptoms for a short period. Most people report improvement in as little as one month.

Start with Wyndly today

Wyndly Summer 2023 Pollen Report Methodology

For each city, Wyndly obtained monthly pollen PPMs (pollen grains per cubic meter) for each form (tree, grass, and weed) from February 2022 - May 2023. Data were obtained from Pollen Sense, LLC Automated Particulate Sensors (APS). These sensors automatically detect particulate matter collected from ambient air, and use a neural network algorithm to identify individual pollen species and calculate daily pollen counts.

Yearly averages are calculated by summing the three allergen averages per month of data for a total monthly PPM, summing all monthly total PPMs, then dividing by 12 (month count). Used for per-city average, state average, and total USA average. Season comparisons are done by summing the months of Spring (March, April, May) for 2023 and 2022. If the absolute of the (2023-2022)/2022 is ≤ 0.05, the years were about the same. Otherwise, the more PPM, the worse the season was.

Is Wyndly right for you?

Answer just a few questions and we'll help you find out.

Get Started Today

Pollen and Allergy Reports by City